
Page 120 - Macromolecular Crystallography
P. 120
MOLECULAR REPLACEMENT TECHNIQUES 109
C-alpha trace Elastic network model
Figure 7.4 Illustration of the Elastic Network Model for thymidylate kinase (cut-off = 8 Ångstroms).
0.25
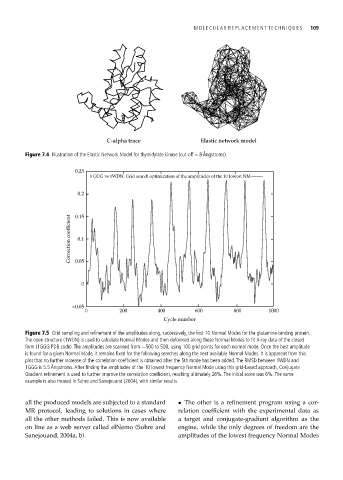
1 GGG vs 1WDN: Grid search optimization of the amplitudes of the 10 lowest NM
0.2
Correction coefficient 0.15
0.1
0.05
0
−0.05
0 200 400 600 800 1000
Cycle number
Figure 7.5 Grid sampling and refinement of the amplitudes along, successively, the first 10 Normal Modes for the glutamine-binding protein.
The open structure (1WDN) is used to calculate Normal Modes and then deformed along these Normal Modes to fit X-ray data of the closed
form (1GGG PDB code). The amplitudes are scanned from −500 to 500, using 100 grid points for each normal mode. Once the best amplitude
is found for a given Normal Mode, it remains fixed for the following searches along the next available Normal Modes. It is apparent from this
plot that no further increase of the correlation coefficient is obtained after the 5th mode has been added. The RMSD between 1WDN and
1GGG is 5.5 Ångstroms. After finding the amplitudes of the 10 lowest frequency Normal Mode using this grid-based approach, Conjugate
Gradient refinement is used to further improve the correlation coefficient, reaching ultimately 26%. The initial score was 6%. The same
example is also treated in Suhre and Sanejouand (2004), with similar results.
all the produced models are subjected to a standard • The other is a refinement program using a cor-
MR protocol, leading to solutions in cases where relation coefficient with the experimental data as
all the other methods failed. This is now available a target and conjugate-gradient algorithm as the
on line as a web server called elNemo (Suhre and engine, while the only degrees of freedom are the
Sanejouand, 2004a, b). amplitudes of the lowest frequency Normal Modes