
Page 129 - Macromolecular Crystallography
P. 129
118 MACROMOLECULAR CRYS TALLOGRAPHY
(a) Selenium Theoretical Plot
X-ray wavelength in Å 0.76Å 0.68Å Se f”
1.80Å
2.47Å
1.41Å
0.86Å
0.99Å
1.16Å
4.0e
Edgeplots web tool /www.bmsc.washington.edu/ scatter/ −2.0e Se f’
2.0e
0.0e
−4.0e
−6.0e
−8.0e
http:/ −10.0e 6000 8000 10,000 12,000 14,000 16,000 18,000 20,000
X-ray energy in eV
(b) Holmium Theoretical Plot
X-ray wavelength in Å
2.47Å 1.80Å 1.41Å 1.16Å 0.99Å 0.86Å 0.76Å 0.68Å
15.0e Ho f”
Ho f’
10.0e
5.0e
Edgeplots web tool /www.bmsc.washington.edu/ scatter/ −10.0e
0.0e
−5.0e
http:/ −15.0e
−20.0e
−25.0e
6000 8000 10,000 12,000 14,000 16,000 18,000 20,000
X-ray energy in eV
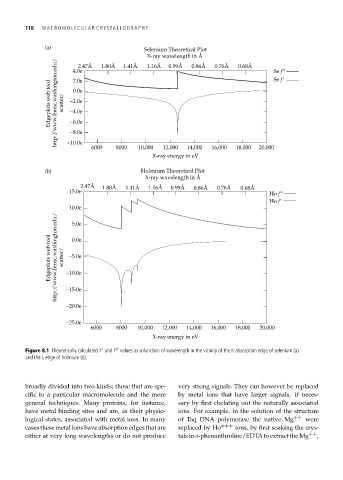
Figure 8.1 Theoretically calculated f and f values as a function of wavelength in the vicinity of the K absorption edge of selenium (a)
and the L edge of holmium (b).
broadly divided into two kinds; those that are spe- very strong signals. They can however be replaced
cific to a particular macromolecule and the more by metal ions that have larger signals, if neces-
general techniques. Many proteins, for instance, sary by first chelating out the naturally associated
have metal binding sites and are, in their physio- ions. For example, in the solution of the structure
logical states, associated with metal ions. In many of Taq DNA polymerase the native Mg ++ were
cases these metal ions have absorption edges that are replaced by Ho +++ ions, by first soaking the crys-
either at very long wavelengths or do not produce tals in o-phenanthroline/EDTAto extract the Mg ++ ,