
Page 133 - Macromolecular Crystallography
P. 133
122 MACROMOLECULAR CRYS TALLOGRAPHY
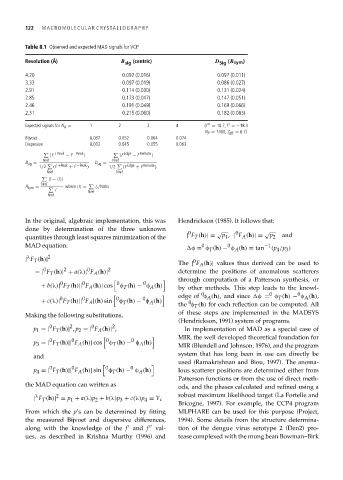
Table 8.1 Observed and expected MAD signals for VCP
Resolution (Å) B sig (centric) D Sig (R sym )
4.20 0.092 (0.016) 0.097 (0.011)
3.33 0.097 (0.019) 0.086 (0.027)
2.91 0.114 (0.030) 0.131 (0.024)
2.85 0.173 (0.047) 0.147 (0.051)
2.46 0.191 (0.049) 0.169 (0.066)
2.31 0.215 (0.060) 0.182 (0.083)
Expected signals for N A = 1 2 3 4 (f = 10.7, f =−18.3
N P = 1400, Z eff = 6.7)
Bijvoet 0.037 0.052 0.064 0.074
Dispersive 0.032 0.045 0.055 0.063
|F − F | |F − F |
+Peak −Peak Edge Remote
Nref Nref
B sig = D sig =
1/2 (F +Peak + F −Peak ) 1/2 (F Edge + F Remote )
Nref Nref
|I − I |
Nref
R Sym = where I = I i /Nobs
I Nref
Nref
In the original, algebraic implementation, this was Hendrickson (1985). It follows that:
done by determination of the three unknown
0 √ 0 √
quantities through least squares minimization of the | F T (h)|= p 1 , | F A (h)|= p 2 and
MAD equation: 0 0 −1
φ = φ T (h) − φ A (h) = tan (p 4 /p 3 )
λ 2
| F T (h)| 0
The | F A (h)| values thus derived can be used to
0 2 0 2
=| F T (h)| + a(λ)| F A (h)| determine the positions of anomalous scatterers
through computation of a Patterson synthesis, or
0
0
0
+ b(λ)| F T (h)|| F A (h)| cos 0 φ (h) − φ (h) by other methods. This step leads to the knowl-
A
T
0
0
0
edge of φ A (h), and since φ = φ T (h) − φ A (h),
0
0
0
0
+ c(λ)| F T (h)|| F A |(h) sin φ (h) − φ (h) the φ T (h) for each reflection can be computed. All
T
0
A
of these steps are implemented in the MADSYS
Making the following substitutions,
(Hendrickson, 1991) system of programs.
0
2
0
2
p 1 =| F T (h)| , p 2 =| F A (h)| , In implementation of MAD as a special case of
MIR, the well developed theoretical foundation for
0 0
0
0
p 3 =| F T (h)|| F A (h)| cos φ T (h) − φ A (h)
MIR (Blundell and Johnson, 1976), and the program
system that has long been in use can directly be
and
used (Ramakrishnan and Biou, 1997). The anoma-
0 0
0
0
p 4 =| F T (h)|| F A (h)| sin φ T (h) − φ A (h) lous scatterer positions are determined either from
Patterson functions or from the use of direct meth-
the MAD equation can written as ods, and the phases calculated and refined using a
λ 2 robust maximum likelihood target (La Fortelle and
| F T (h)| = p 1 + a(λ)p 2 + b(λ)p 3 + c(λ)p 4 = Y c
Bricogne, 1997). For example, the CCP4 program
From which the p’s can be determined by fitting MLPHARE can be used for this purpose (Project,
the measured Bijvoet and dispersive differences, 1994). Some details from the structure determina-
along with the knowledge of the f and f val- tion of the dengue virus serotype 2 (Den2) pro-
ues, as described in Krishna Murthy (1996) and tease complexed with the mung bean Bowman–Birk