
Page 132 - Macromolecular Crystallography
P. 132
MAD PHASING 121
Au Peak
Eu Peak 1.0394
1.7749 1.80Å 1.41Å 1.16Å 0.99Å 0.86Å 0.76Å 0.68Å Au f”
X-ray wavelength in Å
Edgeplots web tool http:/ /www.bmsc.washington.edu/scatter/ −10.0e Eu Remote 1.0375 Au f’
2.47Å
20.0e
Eu f”
Eu f’
15.0e
10.0e
1.7718
5.0e
0.0e
Au Remote
−5.0e
−15.0e
−20.0e
−25.0e
8000
6000
10,000
14,000
12,000
X-ray energy in eV 16,000 18,000 20,000
1.7761 1.0400
Eu Inflection Au Inflection
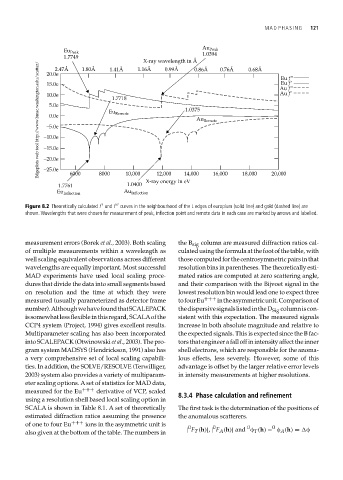
Figure 8.2 Theoretically calculated f and f curves in the neighbourhood of the L edges of europium (solid line) and gold (dashed line) are
shown. Wavelengths that were chosen for measurement of peak, inflection point and remote data in each case are marked by arrows and labelled.
measurement errors (Borek et al., 2003). Both scaling the B sig column are measured diffraction ratios cal-
of multiple measurements within a wavelength as culatedusingtheformulaatthefootofthetable, with
well scaling equivalent observations across different thosecomputedforthecentrosymmetricpairsinthat
wavelengths are equally important. Most successful resolution bins in parentheses. The theoretically esti-
MAD experiments have used local scaling proce- mated ratios are computed at zero scattering angle,
dures that divide the data into small segments based and their comparison with the Bijvoet signal in the
on resolution and the time at which they were lowest resolution bin would lead one to expect three
measured (usually parameterized as detector frame tofourEu +++ intheasymmetricunit. Comparisonof
number).AlthoughwehavefoundthatSCALEPACK thedispersivesignalslistedintheD Sig columniscon-
issomewhatlessflexibleinthisregard, SCALAofthe sistent with this expectation. The measured signals
CCP4 system (Project, 1994) gives excellent results. increase in both absolute magnitude and relative to
Multiparameter scaling has also been incorporated the expected signals. This is expected since the B fac-
into SCALEPACK (Otwinowski et al., 2003). The pro- tors that engineer a fall off in intensity affect the inner
gram system MADSYS (Hendrickson, 1991) also has shell electrons, which are responsible for the anoma-
a very comprehensive set of local scaling capabili- lous effects, less severely. However, some of this
ties. In addition, the SOLVE/RESOLVE (Terwilliger, advantage is offset by the larger relative error levels
2003) system also provides a variety of multiparam- in intensity measurements at higher resolutions.
eter scaling options. A set of statistics for MAD data,
measured for the Eu +++ derivative of VCP, scaled 8.3.4 Phase calculation and refinement
using a resolution shell based local scaling option in
SCALA is shown in Table 8.1. A set of theoretically The first task is the determination of the positions of
estimated diffraction ratios assuming the presence the anomalous scatterers.
of one to four Eu +++ ions in the asymmetric unit is 0 0 0 0
| F T (h)|, | F A (h)| and φ (h) − φ A (h) = φ
also given at the bottom of the table. The numbers in T