
Page 141 - Macromolecular Crystallography
P. 141
130 MACROMOLECULAR CRYS TALLOGRAPHY
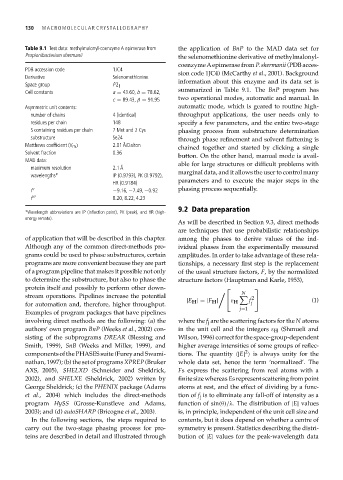
Table 9.1 Test data: methylmalonyl-coenzyme A epimerase from the application of BnP to the MAD data set for
Propionibacterium shermanii the selenomethionine derivative of methylmalonyl-
coenzymeAepimerase from P. shermanii (PDB acces-
PDB accession code 1JC4
sion code 1JC4) (McCarthy et al., 2001). Background
Derivative Selenomethionine
information about this enzyme and its data set is
Space group P2 1
summarized in Table 9.1. The BnP program has
Cell constants a = 43.60, b = 78.62,
c = 89.43, β = 91.95 two operational modes, automatic and manual. In
Asymmetric unit contents: automatic mode, which is geared to routine high-
number of chains 4 (identical) throughput applications, the user needs only to
residues per chain 148 specify a few parameters, and the entire two-stage
S containing residues per chain 7 Met and 2 Cys phasing process from substructure determination
substructure Se24 through phase refinement and solvent flattening is
Matthews coefficient (V m ) 2.01 Å/Dalton
chained together and started by clicking a single
Solvent fraction 0.36
button. On the other hand, manual mode is avail-
MAD data:
able for large structures or difficult problems with
maximum resolution 2.1 Å
wavelengths ∗ IP (0.9793), PK (0.9792), marginal data, and it allows the user to control many
HR (0.9184) parameters and to execute the major steps in the
f −9.16, −7.49, −0.92 phasing process sequentially.
f 8.20, 8.22, 4.23
9.2 Data preparation
∗ Wavelength abbreviations are IP (inflection point), PK (peak), and HR (high-
energy remote).
As will be described in Section 9.3, direct methods
are techniques that use probabilistic relationships
of application that will be described in this chapter. among the phases to derive values of the ind-
Although any of the common direct-methods pro- ividual phases from the experimentally measured
grams could be used to phase substructures, certain amplitudes. In order to take advantage of these rela-
programs are more convenient because they are part tionships, a necessary first step is the replacement
of a program pipeline that makes it possible not only of the usual structure factors, F, by the normalized
to determine the substructure, but also to phase the structure factors (Hauptman and Karle, 1953),
protein itself and possibly to perform other down-
N
stream operations. Pipelines increase the potential 2
|E H |=|F H | ε H f (1)
for automation and, therefore, higher throughput. j
j=1
Examples of program packages that have pipelines
involving direct methods are the following: (a) the where the f j are the scattering factors for the N atoms
authors’ own program BnP (Weeks et al., 2002) con- in the unit cell and the integers ε H (Shmueli and
sisting of the subprograms DREAR (Blessing and Wilson, 1996) correct for the space-group-dependent
Smith, 1999), SnB (Weeks and Miller, 1999), and higher average intensities of some groups of reflec-
2
components of the PHASES suite (Furey and Swami- tions. The quantity |E| is always unity for the
nathan, 1997); (b)thesetofprogramsXPREP (Bruker whole data set, hence the term ‘normalized’. The
AXS, 2005), SHELXD (Schneider and Sheldrick, Fs express the scattering from real atoms with a
2002), and SHELXE (Sheldrick, 2002) written by finite size whereas Es represent scattering from point
George Sheldrick; (c) the PHENIX package (Adams atoms at rest, and the effect of dividing by a func-
et al., 2004) which includes the direct-methods tion of f j is to eliminate any fall-off of intensity as a
program HySS (Grosse-Kunstleve and Adams, function of sin(θ)/λ. The distribution of |E| values
2003); and (d) autoSHARP (Bricogne et al., 2003). is, in principle, independent of the unit cell size and
In the following sections, the steps required to contents, but it does depend on whether a centre of
carry out the two-stage phasing process for pro- symmetry is present. Statistics describing the distri-
teins are described in detail and illustrated through bution of |E| values for the peak-wavelength data