
Page 83 - Macromolecular Crystallography
P. 83
72 MACROMOLECULAR CRYS TALLOGRAPHY
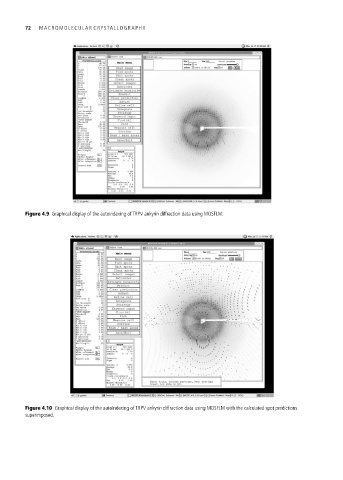
Figure 4.9 Graphical display of the autoindexing of TRPV ankyrin diffraction data using MOSFLM.
Figure 4.10 Graphical display of the autoindexing of TRPV ankyrin diffraction data using MOSFLM with the calculated spot predictions
superimposed.