
Page 84 - Macromolecular Crystallography
P. 84
FIRST ANALYSIS OF MACROMOLECULAR CRYS TALS 73
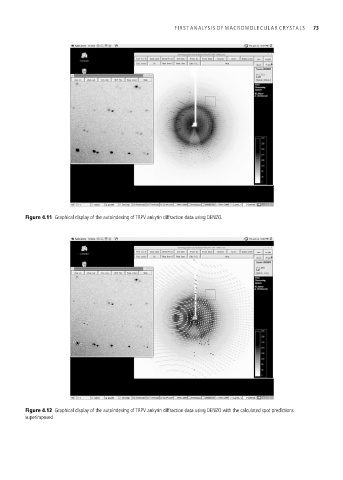
Figure 4.11 Graphical display of the autoindexing of TRPV ankyrin diffraction data using DENZO.
Figure 4.12 Graphical display of the autoindexing of TRPV ankyrin diffraction data using DENZO with the calculated spot predictions
superimposed.