
Page 81 - Macromolecular Crystallography
P. 81
70 MACROMOLECULAR CRYS TALLOGRAPHY
Table 4.3 The seven crystal systems
System Bravais lattices Minimum symmetry of unit cell Restriction on lattice constants
Triclinic P No symmetry a = b = c; α = β = γ
Monoclinic P, C One 2-fold axis, parallel to b a = b = c; α = γ = 90 ; β > 90 ◦
◦
Orthorhombic P, C, I, F Three mutually perpendicular 2-fold axes a = b = c; α = β = γ = 90 ◦
Tetragonal P, I One 4-fold axis, parallel to c a = b = c; α = β = γ = 90 ◦
Trigonal/ P One 3-fold axis, parallel to c a = b = c; α = β = 90 ; γ = 120 ◦
◦
rhombohedral (or R) a a = b = c; α = β = γ = 90 ◦
◦
Hexagonal P One 6-fold axis, parallel to c a = b = c; α = β = 90 ; γ = 120 ◦
Cubic P, I, F Four 3-fold axes along the diagonal of a = b = c; α = β = γ = 90 ◦
the cube
a Rhomobohedral is a subset of the trigonal system in which the unit cell can be chosen on either hexagonal or rhombohedral axes.
4.7 Lattice and space-group
determination from X-ray data
In the past, the traditional way of determining space-
Triclinic
groups and cell dimensions was by analysing X-ray
precession photographs of the undistorted lattice for
P
absences and measuring spot separations in order to
determine lattice dimensions (Abdel-Meguid et al.,
1996). Nowadays, oscillation data collection is usu-
Monoclinic
ally started on a cryocooled crystal mounted in a
loop at an undefined orientation and the space group
P C determined ‘on the fly’ after 10–20 frames have been
collected.
Two processing packages are predominantly used
Orthorhombic
by crystallographers in house and at synchrotrons
indexing of oscillation data. HKL2000 (and its pre-
P C F I decessor DENZO) written by Zbyszek Otwinowski
and Wladek Minor (Otwinowski and Minor, 1997
and 2001) and MOSFLM supported by CCP4 (Leslie,
Tetragonal 1993). Both have very powerful autoindexing rou-
tines. The code for that within HKL (Otwinowski
P I and Minor, 1997) is yet to be fully disclosed as it is a
commercial package and MOSFLM has within it the
powerful algorithm DPS (open source) written by
Michael Rossman and Cees van Beek which uses a
similar method of Fourier indexing (Rossmann and
Trigonal R Hexagonal P
van Beek, 1999; Powell, 1999; Rossmann, 2001) to
that of HKL. Both algorithms are extremely power-
Cubic ful but in the author’s experience they do not always
give the same result with difficult space-group deter-
P F I
minations and it is often useful to run both when
initially indexing a crystal.
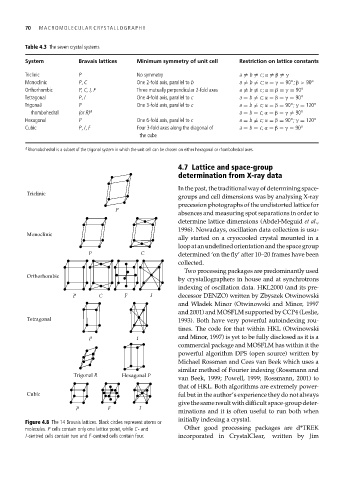
Figure 4.8 The 14 Bravais lattices. Black circles represent atoms or
molecules. P cells contain only one lattice point, while C- and Other good processing packages are d*TREK
I-centred cells contain two and F-centred cells contain four. incorporated in CrystalClear, written by Jim