
Page 77 - Managing Global Warming
P. 77
Greenhouse gas removal and zero emissions energy production 49
2.5.1 Fossil fuel emissions
The IEA [11] reports that GDP and emissions growth have become delinked since
2010 as the annual percentage increase in global emissions has consistently been
lower than that for GDP. They argue that preliminary data for 2015 and 2016 suggest
that emissions have stabilized. They note that this deviates from the long-term trend in
which emissions and GDP have been closely correlated.
This trend combines four drivers: changes in carbon intensity (C/TFC); energy effi-
ciency (TFC/GDP); consumption per capita (GDP/Population); and the growth in
population. Algebraically this may be expressed as follows:
C TFC GDP
C ¼ Population
TFC GDP Population
where C represents the global carbon emissions, TFC is the total final energy con-
sumption, and GDP and Population are their respective global aggregates.
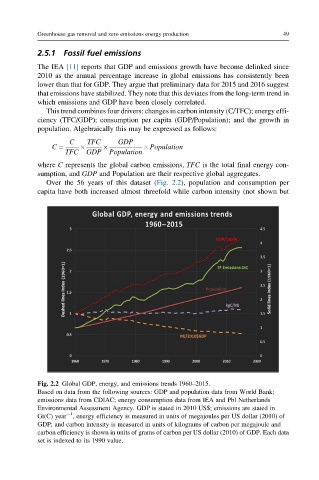
Over the 56 years of this dataset (Fig. 2.2), population and consumption per
capita have both increased almost threefold while carbon intensity (not shown but
Fig. 2.2 Global GDP, energy, and emissions trends 1960–2015.
Based on data from the following sources: GDP and population data from World Bank;
emissions data from CDIAC; energy consumption data from IEA and Pbl Netherlands
Environmental Assessment Agency. GDP is stated in 2010 US$; emissions are stated in
1
Gt(C) year , energy efficiency is measured in units of megajoules per US dollar (2010) of
GDP; and carbon intensity is measured in units of kilograms of carbon per megajoule and
carbon efficiency is shown in units of grams of carbon per US dollar (2010) of GDP. Each data
set is indexed to its 1990 value.