
Page 78 - Managing Global Warming
P. 78
50 Managing Global Warming
trend virtually coincides with energy efficiency) has marginally deteriorated; these
three combine to increase emissions more than sevenfold. Only energy efficiency
has shown a countervailing tendency, having almost doubled in the period. The drivers
when combined account for the almost quadrupling of carbon emissions over the
56 years to 2015. (See also IEA data [12].)
If the trend established since 2010 is maintained, we may be on the threshold of
peak emissions as the shift to ZEE gains momentum, but more data are required before
such a conclusion can be reached with confidence. Preliminary data suggest a 2%
increase in emissions in 2017 after no increase in emissions in 2016 [13]. Another
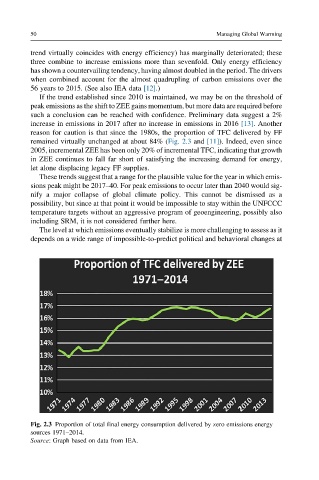
reason for caution is that since the 1980s, the proportion of TFC delivered by FF
remained virtually unchanged at about 84% (Fig. 2.3 and [11]). Indeed, even since
2005, incremental ZEE has been only 20% of incremental TFC, indicating that growth
in ZEE continues to fall far short of satisfying the increasing demand for energy,
let alone displacing legacy FF supplies.
These trends suggest that a range for the plausible value for the year in which emis-
sions peak might be 2017–40. For peak emissions to occur later than 2040 would sig-
nify a major collapse of global climate policy. This cannot be dismissed as a
possibility, but since at that point it would be impossible to stay within the UNFCCC
temperature targets without an aggressive program of geoengineering, possibly also
including SRM, it is not considered further here.
The level at which emissions eventually stabilize is more challenging to assess as it
depends on a wide range of impossible-to-predict political and behavioral changes at
Fig. 2.3 Proportion of total final energy consumption delivered by zero emissions energy
sources 1971–2014.
Source: Graph based on data from IEA.