
Page 126 - Manufacturing Engineering and Technology - Kalpakjian, Serope : Schmid, Steven R.
P. 126
Section 4.3 Phase Diagrams
Alloy composition
` K First solid
1455 - Liquid solution ,W....,. = § ;» (36% Cu-64% Ni)
ilii
4/90/3,08 Llfiuld
(50% cu-50% Ni)
L9 < a /yi
C
A Wa, Solid
S
S
`_, 1313 [_ ____ ________ ____ M;,,,,;;i»»»»»~»»»»~‘~~~»e=w~= ( o U- o I)
Sf)
.,,__,
,,,,,.;»;,;: i:iEEZZZEZEE?iiE?§€iig¢_gz
4; 1288 ----- --'“ “ :' “T”
Liquid
g 1249 -_---- ---- :_-f---' -:--- I- 'iii L (58% Cu-42% Ni)
Q.
Solid
" g Somtion ‘ Solid solution
,...o » (50% cu-50% Ni)
1082 - 1981
_
O 36 42 50 58 67 100 Copper (Cu)
100 64 58 50 42 33 O Nickel (Ni)
Composition (% by weight)
CS CO CL
|_|_l_|.|_i_|_l_l_L|
O 1
Fraction liquid
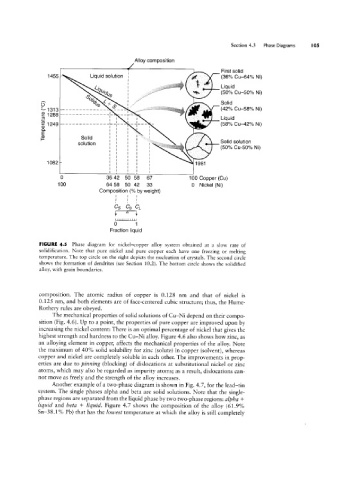
FIGURE 4.5 Phase diagram for nickel-copper alloy system obtained at a slow rate of
solidification. Note that pure nickel and pure copper each have one freezing or melting
temperature. The top circle on the right depicts the nucleation of crystals. The second circle
shows the formation of dendrites (see Section 10.2). The bottom circle shows the solidified
alloy, with grain boundaries.
composition. The atomic radius of copper is 0.128 nm and that of nickel is
0.125 nm, and both elements are of face-centered cubic structure; thus, the Hume-
Rothery rules are obeyed.
The mechanical properties of solid solutions of Cu-Ni depend on their compo-
sition (Fig. 4.6). Up to a point, the properties of pure copper are improved upon by
increasing the nickel content: There is an optimal percentage of nickel that gives the
highest strength and hardness to the Cu-Ni alloy. Figure 4.6 also shows how zinc, as
an alloying element in copper, affects the mechanical properties of the alloy. Note
the maximum of 40% solid solubility for zinc (solute) in copper (solvent), whereas
copper and nickel are completely soluble in each other. The improvements in prop-
erties are due to pinning (blocking) of dislocations at substitutional nickel or zinc
atoms, which may also be regarded as impurity atoms; as a result, dislocations can-
not move as freely and the strength of the alloy increases.
Another example of a two-phase diagram is shown in Fig. 4.7, for the lead-tin
system. The single phases alpha and beta are solid solutions. Note that the single-
phase regions are separated from the liquid phase by two two-phase regions: alpha +
liquid and beta -l- liquid. Figure 4.7 shows the composition of the alloy (61.9%
Sn-38.1% Pb) that has the lowest temperature at which the alloy is still completely