
Page 184 - Marine Structural Design
P. 184
160 Part II Ultimate Strength
P
-
40
- tension
20 8
--- I conpression
*
0 0.2 0.4 0.6
E (%)
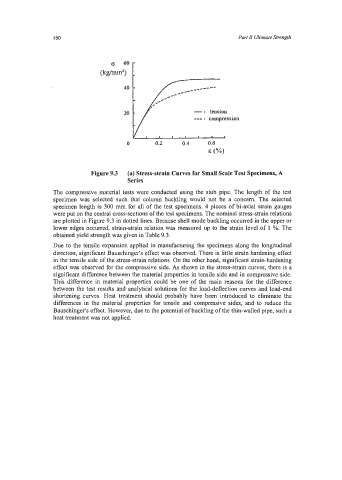
Figure 9.3 (a) Stress-strain Curves for Small Scale Test Specimens, A
Series
The compressive material tests were conducted using the stub pipe. The length of the test
specimen was selected such that column buckling would not be a concern. The selected
specimen length is 300 mm for all of the test specimens. 4 pieces of bi-axial strain gauges
were put on the central cross-sections of the test specimens. The nominal stress-strain relations
are plotted in Figure 9.3 in dotted lines. Because shell mode buckling occurred in the upper or
lower edges occurred, strain-strain relation was measured up to the strain level of 1 %. The
obtained yield strength was given in Table 9.3.
Due to the tensile expansion applied in manufacturing the specimens along the longitudinal
direction, significant Bauschinger's effect was observed. There is little strain hardening effect
in the tensile side of the stress-strain relations. On the other hand, significant strain-hardening
effect was observed for the compressive side. As shown in the stress-strain curves, there is a
significant difference between the material properties in tensile side and in compressive side.
This difference in material properties could be one of the main reasons for the difference
between the test results and analytical solutions for the load-deflection curves and load-end
shortening curves. Heat treatment should probably have been introduced to eliminate the
differences in the material properties for tensile and compressive sides, and to reduce the
Bauschinger's effect. However, due to the potential of buckling of the thin-walled pipe, such a
heat treatment was not applied.