
Page 188 - Marine Structural Design
P. 188
164 Part II Ultimate Strength
Eccentric Axial Compression Test Using Small Scale Specimens
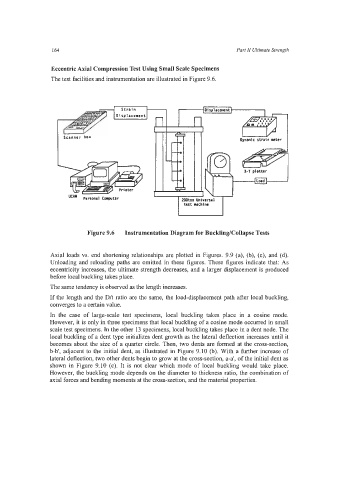
The test facilities and instrumentation are illustrated in Figure 9.6.
u
test uchinr
Figure 9.6 Instrumentation Diagram for BucklingEollapse Tests
Axial loads vs. end shortening relationships are plotted in Figures. 9.9 (a), (b), (c), and (d).
Unloading and reloading paths are omitted in these figures. These figures indicate that: As
eccentricity increases, the ultimate strength decreases, and a larger displacement is produced
before local buckling takes place.
The same tendency is observed as the length increases.
If the length and the D/t ratio are the same, the load-displacement path after local buckling,
converges to a certain value.
In the case of large-scale test specimens, local buckling takes place in a cosine mode.
However, it is only in three specimens that local buckling of a cosine mode occurred in small
scale test specimens. In the other 13 specimens, local buckling takes place in a dent node. The
local buckling of a dent type initializes dent growth as the lateral deflection increases until it
becomes about the size of a quarter circle. Then, two dents are formed at the cross-section,
b-b', adjacent to the initial dent, as illustrated in Figure 9.10 (b). With a further increase of
lateral deflection, two other dents begin to grow at the cross-section, a-a', of the initial dent as
shown in Figure 9.10 (c). It is not clear which mode of local buckling would take place.
However, the buckling mode depends on the diameter to thickness ratio, the combination of
axial forces and bending moments at the cross-section, and the material properties.