
Page 216 - Marine Structural Design
P. 216
192 Part II Ultimate Strength
represent the results obtained from the finite element method without considering local
buckling.
Until local buckling takes place, both results obtained from the present method and the finite
element method, show good correlation's including the ultimate strength. The comparison of
these results using the FEM to the results of other experiments shows little differences among
them, which may be attributed to the reasons described in 9.4.1. However, judging from the
interaction relationships shown in Figure 9.29, these differences may be attributed to the
material properties of the actual material and assumed material used for the analysis. The yield
stress used in the analysis is determined, based on the results of the tensile test, and may be
very accurate as long as the stress is in tension. It is not completely clear, but there may be
some differences in the material properties in a tensile and a compressive range.
:
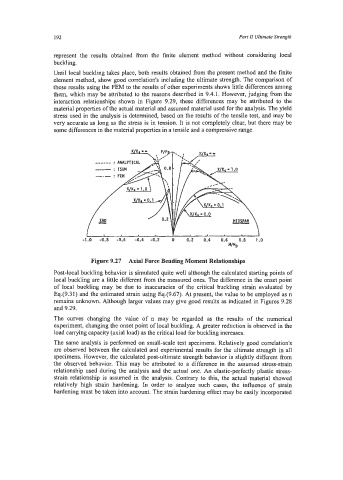
_-__-- ANAL
-: ISM
--- FEM
:
-1.0 -0.8 -0.6 -0.4 -0.2 0 0.2 0.4 0.6 0.8 1.0
Wp
Figure 9.27 Axial Force Bending Moment Relationships
Post-local buckling behavior is simulated quite well although the calculated starting points of
local buckling are a little different from the measured ones. The difference in the onset point
of local buckling may be due to inaccuracies of the critical buckling strain evaluated by
Eq.(9.31) and the estimated strain using Eq.(9.67). At present, the value to be employed as n
remains unknown. Although larger values may give good results as indicated in Figures 9.28
and 9.29.
The curves changing the value of n may be regarded as the results of the numerical
experiment, changing the onset point of local buckling. A greater reduction is observed in the
load canying capacity (axial load) as the critical load for buckling increases.
The same analysis is performed on small-scale test specimens. Relatively good correlation's
are observed between the calculated and experimental results for the ultimate strength in all
specimens. However, the calculated post-ultimate strength behavior is slightly different from
the observed behavior. This may be attributed to a difference in the assumed stress-strain
relationship used during the analysis and the actual one. An elastic-perfectly plastic stress-
strain relationship is assumed in the analysis. Contrary to this, the actual material showed
relatively high strain hardening. In order to analyze such cases, the influence of strain
hardening must be taken into account. The strain hardening effect may be easily incorporated