
Page 354 - Marine Structural Design
P. 354
330 Part III Fatigue and Fracture
N = Predicted number of cycles to failure for stress range S
m = Negative inverse slope of S-N curve (typically m=3)
log K = Intercept of log N-axis by S-N curve = log a - 2std
where, a and std are constant relating to mean S-N curve and standard deviation of log N,
respectively.
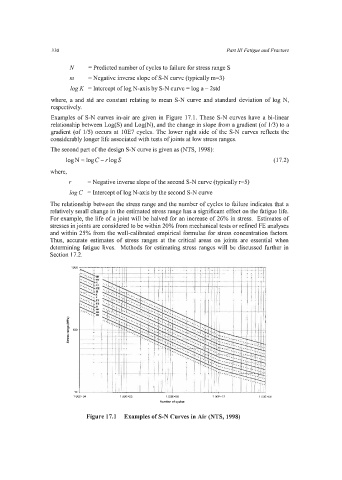
Examples of S-N curves in-air are given in Figure 17.1. These S-N curves have a bi-linear
relationship between Log(S) and Log(N), and the change in slope from a gradient (of 1/3) to a
gradient (of 1/5) occurs at 10E7 cycles. The lower right side of the S-N curves reflects the
considerably longer life associated with tests of joints at low stress ranges.
The second part of the design S-N curve is given as (NTS, 1998):
logN =logC-rlogS (1 7.2)
where,
r = Negative inverse slope of the second S-N curve (typically 1-5)
log C = Intercept of log N-axis by the second S-N curve
The relationship between the stress range and the number of cycles to failure indicates that a
relatively small change in the estimated stress range has a significant effect on the fatigue life.
For example, the life of a joint will be halved for an increase of 26% in stress. Estimates of
stresses in joints are considered to be within 20% from mechanical tests or refined FE analyses
and within 25% from the well-calibrated empirical formulae for stress concentration factors.
Thus, accurate estimates of stress ranges at the critical areas on joints are essential when
determining fatigue lives. Methods for estimating stress ranges will be discussed further in
Section 17.2.
1000
-
i
100
a
1
10
l.OOE+M l.oOE+O5 1.00E+08 1.N +08
Numberot~k.
Figure 17.1 Examples of S-N Curves in Air (NTS, 1998)