
Page 447 - Marine Structural Design
P. 447
Chapter 23 Basics of Structural Reliability 423
23.6.2 Turkstra’s Rule
The loading processes may be searched for some defined maximum in a systematic manner. A
procedure proposed by Turkstra (1972) has found its way into practice. It is based on a
combination model for stationary random process. Its principle is that when one random load
achieves its maximum value in time T, the transient values of other loads can be used to form
the maximum load combination value. Assuming the random loads are represented by Si(t),
the load combination is S(t), i.e.
~(t) CSi (t) (23.28)
=
I
Then, the maximum value of S(t) can be expressed as
s - max s(t) = max (23.29)
- feT
j=1
Where, max Si(t) is the maximum value of Si(t) in time T and S,(t) is the transient value of
other random loads.
It should be noted that different load combinations shall be performed for Eq. (23.29) to derive
the maximum value.
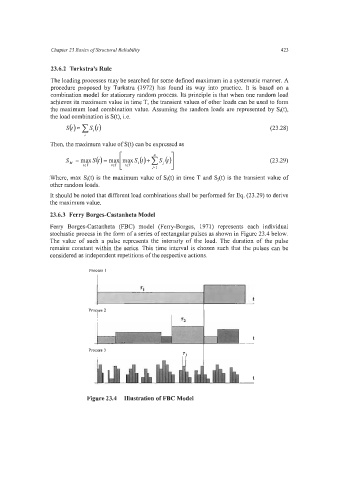
23.6.3 Ferry Borges-Castanheta Model
Ferry Borges-Castanheta (FBC) model (Ferry-Borges, 1971) represents each individual
stochastic process in the form of a series of rectangular pulses as shown in Figure 23.4 below.
The value of such a pulse represents the intensity of the load. The duration of the pulse
remains constant within the series. This time interval is chosen such that the pulses can be
considered as independent repetitions of the respective actions.
Process 1
Process 2
I r2
Process 3 I I
I
Figure 23.4 Illustration of FBC Model