
Page 65 - Marine Structural Design
P. 65
42 Part I Structural Design Principles
3.2.4 Wave Scatter Diagram
Long-term descriptions are required to describe the variation of sea-states. The wave scatter
diagram provides a joint probability table of significant wave heights and characteristic
periods for a site. Beck et a1 (1989) outlined methods of collecting ocean wave data:
(a) Visual estimates of wave conditions (of heights and periods) by trained observers aboard
weather ships: Hogben and Lumb (1967) collected log entries of some 500 British ships
from 1953 to 1961 in oceans of worldwide.
(b) Point Spectra from wave measurements using a ship borne meter: Pierson and Moskowitz
(1964) evaluated the wave generation process and hlly developed spectra in particular.
(c) Directional spectra
(d) US Naval hindcast wave climatology: An alternative to wave data is to calculate a set of
spectra from the comprehensive wind data that have been collected for years over the
important trade routes worldwide, see e.g. Bales et a1 (1 982).
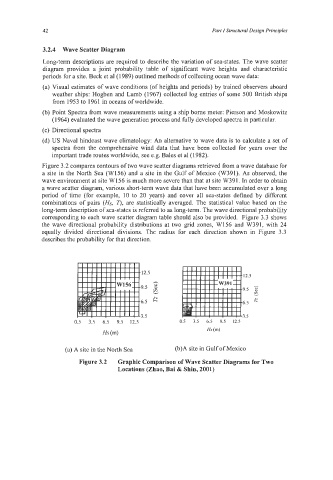
Figure 3.2 compares contours of two wave scatter diagrams retrieved from a wave database for
a site in the North Sea (W156) and a site in the Gulf of Mexico (W391). As observed, the
wave environment at site W156 is much more severe than that at site W391. In order to obtain
a wave scatter diagram, various short-term wave data that have been accumulated over a long
period of time (for example, 10 to 20 years) and cover all sea-states defined by different
combinations of pairs (Hs, 7J, are statistically averaged. The statistical value based on the
long-term description of sea-states is referred to as long-term. The wave directional probability
corresponding to each wave scatter diagram table should also be provided. Figure 3.3 shows
the wave directional probability distributions at two grid zones, W156 and W391, with 24
equally divided directional divisions. The radius for each direction shown in Figure 3.3
describes the probability for that direction.
12.5
12.5
9.5 9.5 8
h
z.
6.5 6.5
-3.5 3.5
0.5 3.5 6.5 9.5 12.5 0.5 3.5 6.5 9.5 1 2 .5
Hs (4
Hs (m)
(a) A site in the North Sea (b)A site in Gulf of Mexico
Figure 3.2 Graphic Comparison of Wave Scatter Diagrams for Two
Locations (Zhao, Bai & Shin, 2001)