
Page 66 - Marine Structural Design
P. 66
Chapter 3 Loads and Dynamic Response for qshore Structures 43
1
6
7
8
13
-
-W156 W391
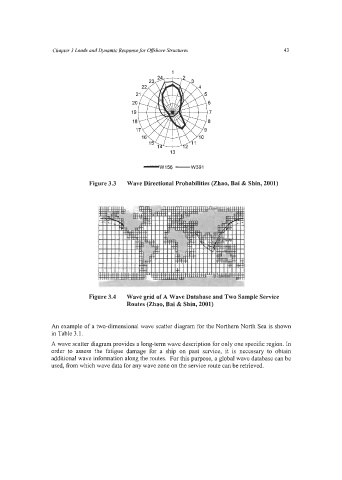
Figure 3.3 Wave Directional Probabilities (Zhao, Bai & Shin, 2001)
Figure 3.4 Wave grid of A Wave Database and Two Sample Service
Routes (Zhao, Bai & Shin, 2001)
An example of a two-dimensional wave scatter diagram for the Northern North Sea is shown
in Table 3.1.
A wave scatter diagram provides a long-term wave description for only one specific region. In
order to assess the fatigue damage for a ship on past service, it is necessary to obtain
additional wave information along the routes. For this purpose, a global wave database can be
used, from which wave data for any wave zone on the service route can be retrieved.