
Page 65 - Marketing Management
P. 65
42 PART 1 UNDERSTANDING MARKETING MANAGEMENT
TABLE 2.4 News Corp. Business Units
Newspapers ($4.5 Billion): New York Post, Wall Street Journal, The Sun (UK)
Magazines ($1 Billion): Weekly Standard, TV Guide
Book Publishing ($1.3 Billion): HarperCollins
Broadcast TV ($5.7 Billion): Fox Network, WNYW New York, KTTV Los Angeles
Cable Networks ($4 Billion): FX, FSN, Fox News Channel
Satellite Television ($3 Billion): Sky Italia, BSkyB, Tata Sky
Filmed Entertainment ($6.7 Billion): 20th Century Fox, Fox Searchlight Pictures, Blue Sky Studios
Other ($2.3 Billion): MySpace, IGN Entertainment, Jamba, Hulu
Assigning Resources to Each SBU 21
Once it has defined SBUs, management must decide how to allocate corporate resources to each.
Several portfolio-planning models provide ways to make investment decisions. The GE/McKinsey
Matrix classifies each SBU by the extent of its competitive advantage and the attractiveness of its
industry. Management can decide to grow,“harvest” or draw cash from, or hold on to the business.
Another model, BCG’s Growth-Share Matrix, uses relative market share and annual rate of market
growth as criteria to make investment decisions, classifying SBUs as dogs, cash cows, question
marks, and stars.
Portfolio-planning models like these have fallen out of favor as oversimplified and subjective.
Newer methods rely on shareholder value analysis, and on whether the market value of a company
is greater with an SBU or without it (whether it is sold or spun off). These value calculations assess
the potential of a business based on growth opportunities from global expansion, repositioning or
retargeting, and strategic outsourcing.
Assessing Growth Opportunities
Assessing growth opportunities includes planning new businesses, downsizing, and terminating
older businesses. If there is a gap between future desired sales and projected sales, corporate
management will need to develop or acquire new businesses to fill it.
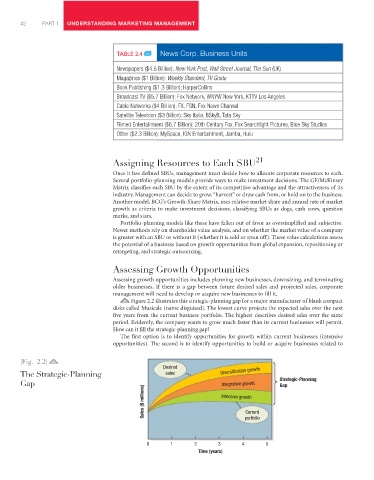
Figure 2.2 illustrates this strategic-planning gap for a major manufacturer of blank compact
disks called Musicale (name disguised). The lowest curve projects the expected sales over the next
five years from the current business portfolio. The highest describes desired sales over the same
period. Evidently, the company wants to grow much faster than its current businesses will permit.
How can it fill the strategic-planning gap?
The first option is to identify opportunities for growth within current businesses (intensive
opportunities). The second is to identify opportunities to build or acquire businesses related to
|Fig. 2.2|
Desired
The Strategic-Planning sales Diversification growth
Strategic-Planning
Gap Integrative growth Gap
Sales ($ millions) Intensive growth
Current
portfolio
0 1 2 3 4 5
Time (years)