
Page 294 - Marks Calculation for Machine Design
P. 294
P1: Shashi
January 4, 2005
Brown˙C07
Brown.cls
276
Finite life
S f 15:4 STRENGTH OF MACHINES Infinite life
Low cycle High cycle
S ut
Fatigue strength
S e
0
10 0 10 1 10 2 10 3 10 4 10 5 10 6 10 7 10 8 N
Number of cycles
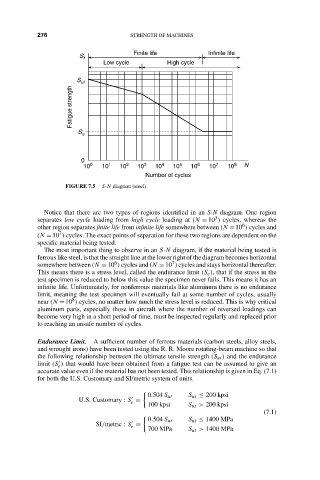
FIGURE 7.5 S-N diagram (steel).
Notice that there are two types of regions identified in an S-N diagram. One region
3
separates low cycle loading from high cycle loading at (N = 10 ) cycles, whereas the
6
other region separates finite life from infinite life somewhere between (N =10 ) cycles and
7
(N =10 ) cycles. The exact points of separation for these two regions are dependent on the
specific material being tested.
The most important thing to observe in an S-N diagram, if the material being tested is
ferrous like steel, is that the straight line at the lower right of the diagram becomes horizontal
6
7
somewhere between (N = 10 ) cycles and (N = 10 ) cycles and stays horizontal thereafter.
This means there is a stress level, called the endurance limit (S e ), that if the stress in the
test specimen is reduced to below this value the specimen never fails. This means it has an
infinite life. Unfortunately, for nonferrous materials like aluminum there is no endurance
limit, meaning the test specimen will eventually fail at some number of cycles, usually
8
near (N =10 ) cycles, no matter how much the stress level is reduced. This is why critical
aluminum parts, especially those in aircraft where the number of reversed loadings can
become very high in a short period of time, must be inspected regularly and replaced prior
to reaching an unsafe number of cycles.
Endurance Limit. A sufficient number of ferrous materials (carbon steels, alloy steels,
and wrought irons) have been tested using the R. R. Moore rotating-beam machine so that
the following relationship between the ultimate tensile strength (S ut ) and the endurance
limit (S ) that would have been obtained from a fatigue test can be assumed to give an
e
accurate value even if the material has not been tested. This relationship is given in Eq. (7.1)
for both the U.S. Customary and SI/metric system of units.
0.504 S ut S ut ≤ 200 kpsi
U.S. Customary : S =
e
100 kpsi S ut > 200 kpsi
(7.1)
0.504 S ut S ut ≤ 1400 MPa
SI/metric : S =
e
700 MPa S ut > 1400 MPa