
Page 293 - Marks Calculation for Machine Design
P. 293
P1: Shashi
January 4, 2005
Brown˙C07
Brown.cls
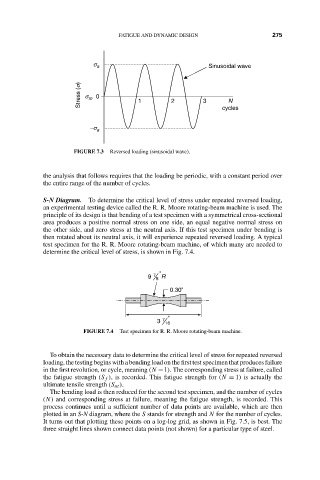
s a 15:4 FATIGUE AND DYNAMIC DESIGN Sinusoidal wave 275
Stress (s) s m 0 1 2 3 cycles
N
-s a
FIGURE 7.3 Reversed loading (sinusoidal wave).
the analysis that follows requires that the loading be periodic, with a constant period over
the entire range of the number of cycles.
S-N Diagram. To determine the critical level of stress under repeated reversed loading,
an experimental testing device called the R. R. Moore rotating-beam machine is used. The
principle of its design is that bending of a test specimen with a symmetrical cross-sectional
area produces a positive normal stress on one side, an equal negative normal stress on
the other side, and zero stress at the neutral axis. If this test specimen under bending is
then rotated about its neutral axis, it will experience repeated reversed loading. A typical
test specimen for the R. R. Moore rotating-beam machine, of which many are needed to
determine the critical level of stress, is shown in Fig. 7.4.
"
7
9 R
8
0.30"
"
3 7 16
FIGURE 7.4 Test specimen for R. R. Moore rotating-beam machine.
To obtain the necessary data to determine the critical level of stress for repeated reversed
loading, the testing begins with a bending load on the first test specimen that produces failure
in the first revolution, or cycle, meaning (N =1). The corresponding stress at failure, called
the fatigue strength (S f ), is recorded. This fatigue strength for (N = 1) is actually the
ultimate tensile strength (S ut ).
The bending load is then reduced for the second test specimen, and the number of cycles
(N) and corresponding stress at failure, meaning the fatigue strength, is recorded. This
process continues until a sufficient number of data points are available, which are then
plotted in an S-N diagram, where the S stands for strength and N for the number of cycles.
It turns out that plotting these points on a log-log grid, as shown in Fig. 7.5, is best. The
three straight lines shown connect data points (not shown) for a particular type of steel.