
Page 146 - Master Handbook of Acoustics
P. 146
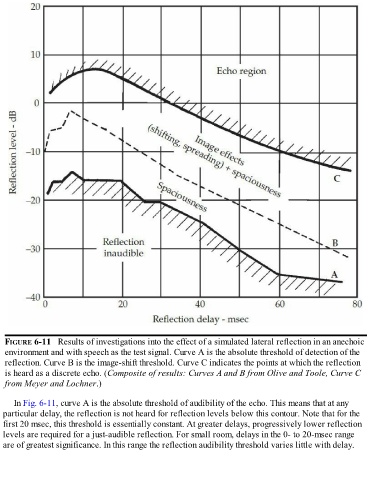
FIGURE 6-11   Results of investigations into the effect of a simulated lateral reflection in an anechoic
   environment and with speech as the test signal. Curve A is the absolute threshold of detection of the
   reflection. Curve B is the image-shift threshold. Curve C indicates the points at which the reflection
   is heard as a discrete echo. (Composite of results: Curves A and B from Olive and Toole, Curve C
   from Meyer and Lochner.)


      In Fig. 6-11, curve A is the absolute threshold of audibility of the echo. This means that at any

  particular delay, the reflection is not heard for reflection levels below this contour. Note that for the
  first 20 msec, this threshold is essentially constant. At greater delays, progressively lower reflection
  levels are required for a just-audible reflection. For small room, delays in the 0- to 20-msec range
  are of greatest significance. In this range the reflection audibility threshold varies little with delay.