
Page 185 - Master Handbook of Acoustics
P. 185
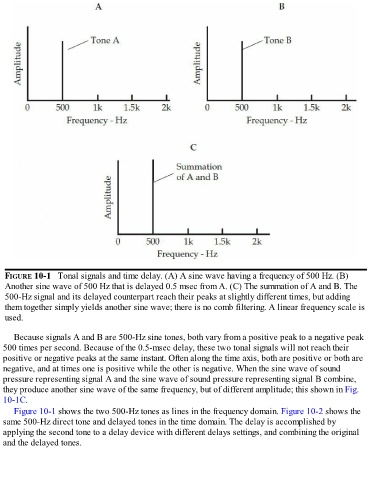
FIGURE 10-1   Tonal signals and time delay. (A) A sine wave having a frequency of 500 Hz. (B)
   Another sine wave of 500 Hz that is delayed 0.5 msec from A. (C) The summation of A and B. The
   500-Hz signal and its delayed counterpart reach their peaks at slightly different times, but adding

   them together simply yields another sine wave; there is no comb filtering. A linear frequency scale is
   used.


      Because signals A and B are 500-Hz sine tones, both vary from a positive peak to a negative peak
  500 times per second. Because of the 0.5-msec delay, these two tonal signals will not reach their
  positive or negative peaks at the same instant. Often along the time axis, both are positive or both are
  negative, and at times one is positive while the other is negative. When the sine wave of sound

  pressure representing signal A and the sine wave of sound pressure representing signal B combine,
  they produce another sine wave of the same frequency, but of different amplitude; this shown in Fig.
  10-1C.
      Figure 10-1 shows the two 500-Hz tones as lines in the frequency domain. Figure 10-2 shows the
  same 500-Hz direct tone and delayed tones in the time domain. The delay is accomplished by
  applying the second tone to a delay device with different delays settings, and combining the original

  and the delayed tones.