
Page 187 - Master Handbook of Acoustics
P. 187
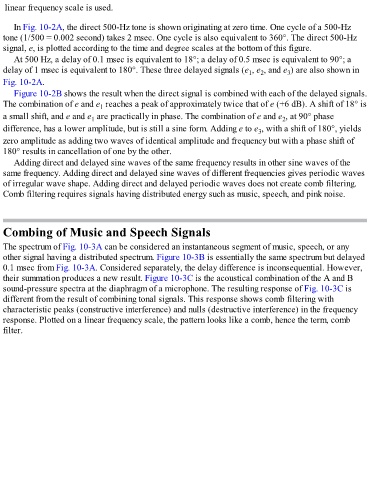
linear frequency scale is used.


      In Fig. 10-2A, the direct 500-Hz tone is shown originating at zero time. One cycle of a 500-Hz
  tone (1/500 = 0.002 second) takes 2 msec. One cycle is also equivalent to 360°. The direct 500-Hz
  signal, e, is plotted according to the time and degree scales at the bottom of this figure.

      At 500 Hz, a delay of 0.1 msec is equivalent to 18°; a delay of 0.5 msec is equivalent to 90°; a
  delay of 1 msec is equivalent to 180°. These three delayed signals (e , e , and e ) are also shown in
                                                                                       2
                                                                                                3
                                                                                   1
  Fig. 10-2A.
      Figure 10-2B shows the result when the direct signal is combined with each of the delayed signals.
  The combination of e and e  reaches a peak of approximately twice that of e (+6 dB). A shift of 18° is
                                  1
  a small shift, and e and e  are practically in phase. The combination of e and e , at 90° phase
                                                                                              2
                               1
  difference, has a lower amplitude, but is still a sine form. Adding e to e , with a shift of 180°, yields
                                                                                      3
  zero amplitude as adding two waves of identical amplitude and frequency but with a phase shift of
  180° results in cancellation of one by the other.

      Adding direct and delayed sine waves of the same frequency results in other sine waves of the
  same frequency. Adding direct and delayed sine waves of different frequencies gives periodic waves
  of irregular wave shape. Adding direct and delayed periodic waves does not create comb filtering.
  Comb filtering requires signals having distributed energy such as music, speech, and pink noise.


  Combing of Music and Speech Signals

  The spectrum of Fig. 10-3A can be considered an instantaneous segment of music, speech, or any
  other signal having a distributed spectrum. Figure 10-3B is essentially the same spectrum but delayed
  0.1 msec from Fig. 10-3A. Considered separately, the delay difference is inconsequential. However,

  their summation produces a new result. Figure 10-3C is the acoustical combination of the A and B
  sound-pressure spectra at the diaphragm of a microphone. The resulting response of Fig. 10-3C is
  different from the result of combining tonal signals. This response shows comb filtering with
  characteristic peaks (constructive interference) and nulls (destructive interference) in the frequency
  response. Plotted on a linear frequency scale, the pattern looks like a comb, hence the term, comb
  filter.