
Page 193 - Master Handbook of Acoustics
P. 193
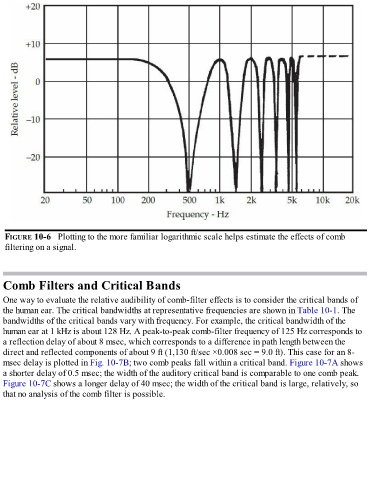
FIGURE 10-6   Plotting to the more familiar logarithmic scale helps estimate the effects of comb
   filtering on a signal.


  Comb Filters and Critical Bands

  One way to evaluate the relative audibility of comb-filter effects is to consider the critical bands of
  the human ear. The critical bandwidths at representative frequencies are shown in Table 10-1. The

  bandwidths of the critical bands vary with frequency. For example, the critical bandwidth of the
  human ear at 1 kHz is about 128 Hz. A peak-to-peak comb-filter frequency of 125 Hz corresponds to
  a reflection delay of about 8 msec, which corresponds to a difference in path length between the
  direct and reflected components of about 9 ft (1,130 ft/sec ×0.008 sec = 9.0 ft). This case for an 8-
  msec delay is plotted in Fig. 10-7B; two comb peaks fall within a critical band. Figure 10-7A shows
  a shorter delay of 0.5 msec; the width of the auditory critical band is comparable to one comb peak.
  Figure 10-7C shows a longer delay of 40 msec; the width of the critical band is large, relatively, so
  that no analysis of the comb filter is possible.