
Page 76 - Master Handbook of Acoustics
P. 76
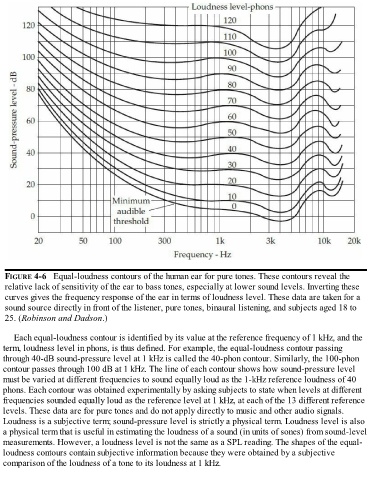
FIGURE 4-6   Equal-loudness contours of the human ear for pure tones. These contours reveal the
   relative lack of sensitivity of the ear to bass tones, especially at lower sound levels. Inverting these

   curves gives the frequency response of the ear in terms of loudness level. These data are taken for a
   sound source directly in front of the listener, pure tones, binaural listening, and subjects aged 18 to
   25. (Robinson and Dadson.)


      Each equal-loudness contour is identified by its value at the reference frequency of 1 kHz, and the
  term, loudness level in phons, is thus defined. For example, the equal-loudness contour passing
  through 40-dB sound-pressure level at 1 kHz is called the 40-phon contour. Similarly, the 100-phon
  contour passes through 100 dB at 1 kHz. The line of each contour shows how sound-pressure level

  must be varied at different frequencies to sound equally loud as the 1-kHz reference loudness of 40
  phons. Each contour was obtained experimentally by asking subjects to state when levels at different
  frequencies sounded equally loud as the reference level at 1 kHz, at each of the 13 different reference
  levels. These data are for pure tones and do not apply directly to music and other audio signals.
  Loudness is a subjective term; sound-pressure level is strictly a physical term. Loudness level is also
  a physical term that is useful in estimating the loudness of a sound (in units of sones) from sound-level
  measurements. However, a loudness level is not the same as a SPL reading. The shapes of the equal-

  loudness contours contain subjective information because they were obtained by a subjective
  comparison of the loudness of a tone to its loudness at 1 kHz.