
Page 77 - Master Handbook of Acoustics
P. 77
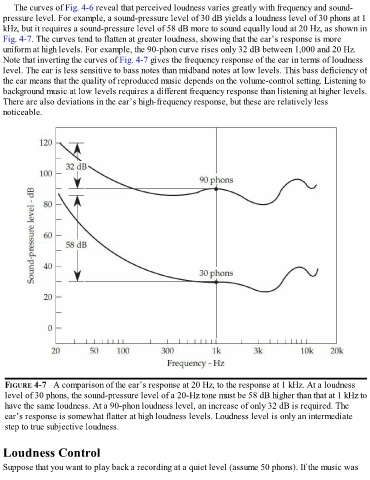
The curves of Fig. 4-6 reveal that perceived loudness varies greatly with frequency and sound-
  pressure level. For example, a sound-pressure level of 30 dB yields a loudness level of 30 phons at 1
  kHz, but it requires a sound-pressure level of 58 dB more to sound equally loud at 20 Hz, as shown in
  Fig. 4-7. The curves tend to flatten at greater loudness, showing that the ear’s response is more

  uniform at high levels. For example, the 90-phon curve rises only 32 dB between 1,000 and 20 Hz.
  Note that inverting the curves of Fig. 4-7 gives the frequency response of the ear in terms of loudness
  level. The ear is less sensitive to bass notes than midband notes at low levels. This bass deficiency of
  the ear means that the quality of reproduced music depends on the volume-control setting. Listening to
  background music at low levels requires a different frequency response than listening at higher levels.
  There are also deviations in the ear’s high-frequency response, but these are relatively less
  noticeable.


   FIGURE 4-7   A comparison of the ear’s response at 20 Hz, to the response at 1 kHz. At a loudness
   level of 30 phons, the sound-pressure level of a 20-Hz tone must be 58 dB higher than that at 1 kHz to
   have the same loudness. At a 90-phon loudness level, an increase of only 32 dB is required. The
   ear’s response is somewhat flatter at high loudness levels. Loudness level is only an intermediate
   step to true subjective loudness.


  Loudness Control


  Suppose that you want to play back a recording at a quiet level (assume 50 phons). If the music was