
Page 172 - Materials Science and Engineering An Introduction
P. 172
144 • Chapter 5 / Diffusion
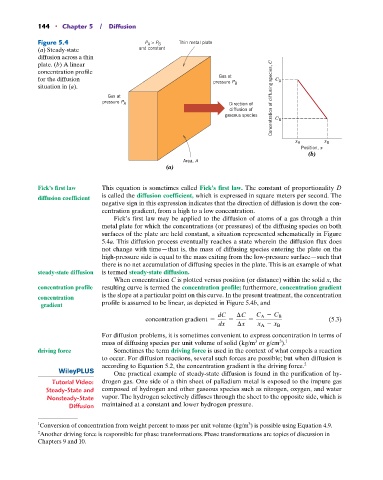
Figure 5.4 P > P Thin metal plate
A B
(a) Steady-state and constant
diffusion across a thin
plate. (b) A linear
concentration profile
Gas at
for the diffusion pressure P C A
situation in (a). B
Gas at Concentration of diffusing species, C
pressure P A Direction of
diffusion of
gaseous species C B
x A x B
Position, x
(b)
Area, A
(a)
Fick’s first law This equation is sometimes called Fick’s first law. The constant of proportionality D
is called the diffusion coefficient, which is expressed in square meters per second. The
diffusion coefficient
negative sign in this expression indicates that the direction of diffusion is down the con-
centration gradient, from a high to a low concentration.
Fick’s first law may be applied to the diffusion of atoms of a gas through a thin
metal plate for which the concentrations (or pressures) of the diffusing species on both
surfaces of the plate are held constant, a situation represented schematically in Figure
5.4a. This diffusion process eventually reaches a state wherein the diffusion flux does
not change with time—that is, the mass of diffusing species entering the plate on the
high-pressure side is equal to the mass exiting from the low-pressure surface—such that
there is no net accumulation of diffusing species in the plate. This is an example of what
steady-state diffusion is termed steady-state diffusion.
When concentration C is plotted versus position (or distance) within the solid x, the
concentration profile resulting curve is termed the concentration profile; furthermore, concentration gradient
is the slope at a particular point on this curve. In the present treatment, the concentration
concentration profile is assumed to be linear, as depicted in Figure 5.4b, and
gradient
dC C C A - C B
concentration gradient = = = (5.3)
dx x x A - x B
For diffusion problems, it is sometimes convenient to express concentration in terms of
3
3 1
mass of diffusing species per unit volume of solid (kg/m or g/cm ).
driving force Sometimes the term driving force is used in the context of what compels a reaction
to occur. For diffusion reactions, several such forces are possible; but when diffusion is
according to Equation 5.2, the concentration gradient is the driving force. 2
One practical example of steady-state diffusion is found in the purification of hy-
Tutorial Video: drogen gas. One side of a thin sheet of palladium metal is exposed to the impure gas
Steady-State and composed of hydrogen and other gaseous species such as nitrogen, oxygen, and water
Nonsteady-State vapor. The hydrogen selectively diffuses through the sheet to the opposite side, which is
Diffusion maintained at a constant and lower hydrogen pressure.
1 Conversion of concentration from weight percent to mass per unit volume (kg/m ) is possible using Equation 4.9.
3
2 Another driving force is responsible for phase transformations. Phase transformations are topics of discussion in
Chapters 9 and 10.