
Page 193 - Materials Chemistry, Second Edition
P. 193
180 3 Metals
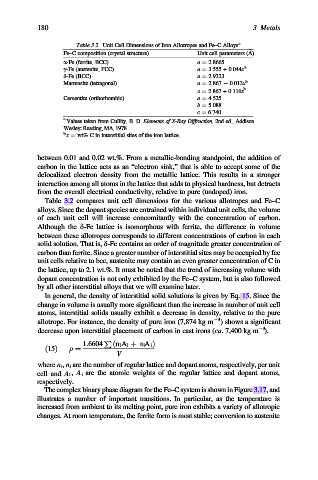
Table 3.2. Unit Cell Dimensions of Iron Allotropes and Fe–C Alloys a
˚
Fe–C composition (crystal structure) Unit cell parameters (A)
a-Fe (ferrite, BCC) a ¼ 2.8665
b
g-Fe (austenite, FCC) a ¼ 3.555 + 0.044x
d-Fe (BCC) a ¼ 2.9323
Martensite (tetragonal) a ¼ 2.867 0.013x b
b
c ¼ 2.867 + 0.116x
Cementite (orthorhombic) a ¼ 4.525
b ¼ 5.088
c ¼ 6.740
a
Values taken from Cullity, B. D. Elements of X-Ray Diffraction, 2nd ed., Addison
Wesley: Reading, MA, 1978.
b
x ¼ wt% C in interstitial sites of the iron lattice.
between 0.01 and 0.02 wt.%. From a metallic-bonding standpoint, the addition of
carbon in the lattice acts as an “electron sink,” that is able to accept some of the
delocalized electron density from the metallic lattice. This results in a stronger
interaction among all atoms in the lattice that adds to physical hardness, but detracts
from the overall electrical conductivity, relative to pure (undoped) iron.
Table 3.2 compares unit cell dimensions for the various allotropes and Fe–C
alloys. Since the dopant species are entrained within individual unit cells, the volume
of each unit cell will increase concomitantly with the concentration of carbon.
Although the d-Fe lattice is isomorphous with ferrite, the difference in volume
between these allotropes corresponds to different concentrations of carbon in each
solid solution. That is, d-Fe contains an order of magnitude greater concentration of
carbon than ferrite. Since a greater number of interstitial sites may be occupied by fcc
unit cells relative to bcc, austenite may contain an even greater concentration of C in
the lattice, up to 2.1 wt.%. It must be noted that the trend of increasing volume with
dopant concentration is not only exhibited by the Fe–C system, but is also followed
by all other interstitial alloys that we will examine later.
In general, the density of interstitial solid solutions is given by Eq. 15. Since the
change in volume is usually more significant than the increase in number of unit cell
atoms, interstitial solids usually exhibit a decrease in density, relative to the pure
3
allotrope. For instance, the density of pure iron (7,874 kg m ) shows a significant
3
decrease upon interstitial placement of carbon in cast irons (ca. 7,400 kg m ).
P
1:6604 ðn l A l þ n i A i Þ
ð15Þ r ¼
V
where n 1 , n i are the number of regular lattice and dopant atoms, respectively, per unit
cell and A 1 , A i are the atomic weights of the regular lattice and dopant atoms,
respectively.
The complex binary phase diagram for the Fe–C system is shown in Figure 3.17,and
illustrates a number of important transitions. In particular, as the temperature is
increased from ambient to its melting point, pure iron exhibits a variety of allotropic
changes. At room temperature, the ferrite form is most stable; conversion to austenite