
Page 208 - Materials Chemistry, Second Edition
P. 208
195
3.2. Metallic Structures and Properties
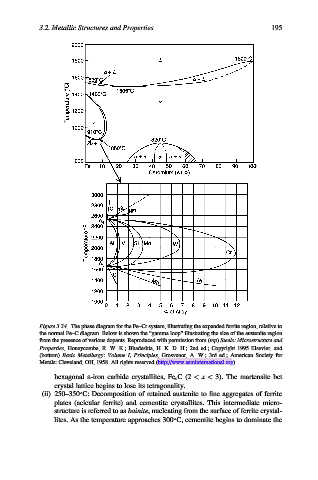
Figure 3.24. The phase diagram for the Fe–Cr system, illustrating the expanded ferrite region, relative to
the normal Fe–C diagram. Below is shown the “gamma loop” illustrating the size of the austenite region
from the presence of various dopants. Reproduced with permission from (top) Steels: Microstructure and
Properties, Honeycombe, R. W. K.; Bhadeshia, H. K. D. H.; 2nd ed.; Copyright 1995 Elsevier, and
(bottom) Basic Metallurgy: Volume I, Principles, Grosvenor, A. W.; 3rd ed.; American Society for
Metals: Cleveland, OH, 1958. All rights reserved (http://www.asminternational.org).
hexagonal e-iron carbide crystallites, Fe x C(2 < x < 3). The martensite bct
crystal lattice begins to lose its tetragonality.
(ii) 250–350 C: Decomposition of retained austenite to fine aggregates of ferrite
plates (acicular ferrite) and cementite crystallites. This intermediate micro-
structure is referred to as bainite, nucleating from the surface of ferrite crystal-
lites. As the temperature approaches 300 C, cementite begins to dominate the