
Page 34 - Mathematical Models and Algorithms for Power System Optimization
P. 34
24 Chapter 2
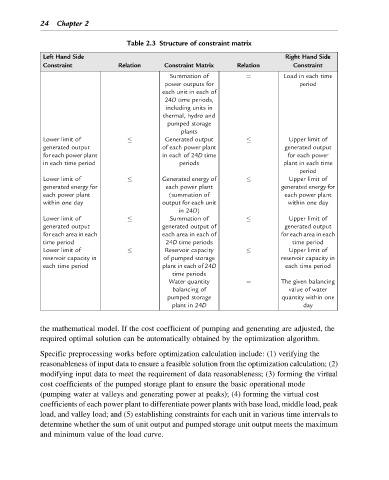
Table 2.3 Structure of constraint matrix
Left Hand Side Right Hand Side
Constraint Relation Constraint Matrix Relation Constraint
¼
Summation of Load in each time
power outputs for period
each unit in each of
24D time periods,
including units in
thermal, hydro and
pumped storage
plants
Lower limit of Generated output Upper limit of
generated output of each power plant generated output
for each power plant in each of 24D time for each power
in each time period periods plant in each time
period
Lower limit of Generated energy of Upper limit of
generated energy for each power plant generated energy for
each power plant (summation of each power plant
within one day output for each unit within one day
in 24D)
Lower limit of Summation of Upper limit of
generated output generated output of generated output
for each area in each each area in each of for each area in each
time period 24D time periods time period
Lower limit of Reservoir capacity Upper limit of
reservoir capacity in of pumped storage reservoir capacity in
plant in each of 24D
each time period each time period
time periods
¼
Water quantity The given balancing
balancing of value of water
pumped storage quantity within one
plant in 24D day
the mathematical model. If the cost coefficient of pumping and generating are adjusted, the
required optimal solution can be automatically obtained by the optimization algorithm.
Specific preprocessing works before optimization calculation include: (1) verifying the
reasonableness of input data to ensure a feasible solution from the optimization calculation; (2)
modifying input data to meet the requirement of data reasonableness; (3) forming the virtual
cost coefficients of the pumped storage plant to ensure the basic operational mode
(pumping water at valleys and generating power at peaks); (4) forming the virtual cost
coefficients of each power plant to differentiate power plants with base load, middle load, peak
load, and valley load; and (5) establishing constraints for each unit in various time intervals to
determine whether the sum of unit output and pumped storage unit output meets the maximum
and minimum value of the load curve.