
Page 643 - Mathematical Techniques of Fractional Order Systems
P. 643
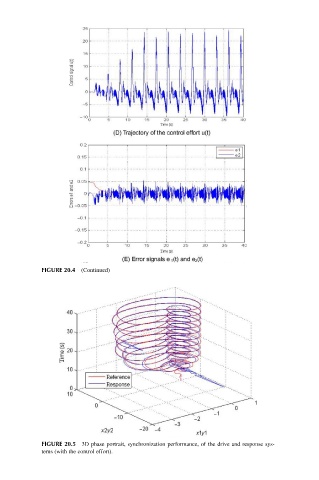
FIGURE 20.4 (Continued)


            FIGURE 20.5 3D phase portrait, synchronization performance, of the drive and response sys-
            tems (with the control effort).