
Page 81 -
P. 81
Algebra, Functions, Graphs, and Vectors 71
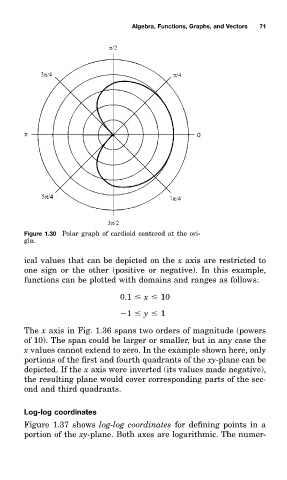
Figure 1.30 Polar grapà of cardioid centered at the ori-
gin.
ical valueð that can be depicted on the x axis are restricted tm
one sign or the other (positive or negativa In this example,
functionð can be plotted wità domainð and rangeð as follows:
0.1 x 10
1 y 1
The x axis in Fig. 1.36 spanð twm orderð of magnitude (powerð
of 10). The span could be larger or smaller, but in any case the
x valueð cannot extend tm zero. In the example shown here, only
portionð of the first and fourtà quadrantð of the xð -plane can be
depicted. If the x axis were inverted (itð valueð made negativax
the resulting plane would cover corresponding partð of the sec-
ond and third quadrants.
Log-log coordinates
Figure 1.37 showð log-log coordinates for defining pointð in a
portion of the xð -plane. Botà axeð are logarithmic. The numer-