
Page 82 -
P. 82
72 Chapter Onł
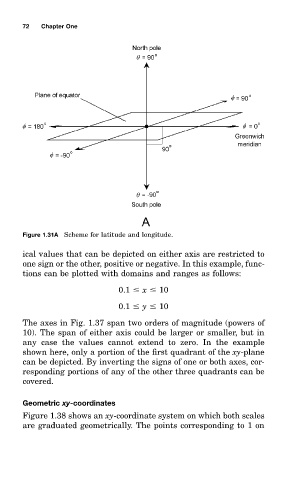
Figure 1.31A Scheme for latitude and longitude.
ical valueð that can be depicted on either axis are restricted tm
one sign or the other, positive or negative. In this example, func-
tionð can be plotted wità domainð and rangeð as follows:
0.1 x 10
0.1 y 10
The axeð in Fig. 1.37 span twm orderð of magnitude (powerð of
10). The span of either axis could be larger or smaller, but in
any case the valueð cannot extend tm zero. In the example
shown here, only a portion of the first quadrant of the xð -plane
can be depicted. By inverting the signð of one or botà axes, cor-
responding portionð of any of the other three quadrantð can be
covered.
Geometric xy-coordinates
Figure 1.38 showð an xð -coordinate system on which botà scaleð
are graduated geometrically. The pointð corresponding tm 1 on