
Page 301 - Matrix Analysis & Applied Linear Algebra
P. 301
5.4 Orthogonal Vectors 297
Since z x varies continuously with x, the existence of a “near” linear relationship
between x and y is equivalent to z x being “close” to ±z y in some sense. The
√
fact that z x = ±z y = n means z x and ±z y differ only in orientation,
so a natural measure of how close z x is to ±z y is cos θ, where θ is the angle
between z x and z y . The number
T T T
z x z y z x z y (x − µ x e) (y − µ y e)
ρ xy = cos θ = = =
z x z y n x − µ x e y − µ y e
is called the coefficient of linear correlation, and the following facts are now
immediate.
• ρ xy =0 if and only if x and y are orthogonal, in which case we say that
x and y are completely uncorrelated.
• |ρ xy | =1 if and only if y is perfectly correlated with x. That is, |ρ xy | =1
if and only if there exists a linear relationship y = β 0 e + β 1 x.
When β 1 > 0, we say that y is positively correlated with x.
When β 1 < 0, we say that y is negatively correlated with x.
• |ρ xy | measures the degree to which y is linearly related to x. In other
words, |ρ xy |≈ 1if and only if y ≈ β 0 e + β 1 x for some β 0 and β 1 .
Positive correlation is measured by the degree to which ρ xy ≈ 1.
Negative correlation is measured by the degree to which ρ xy ≈−1.
2
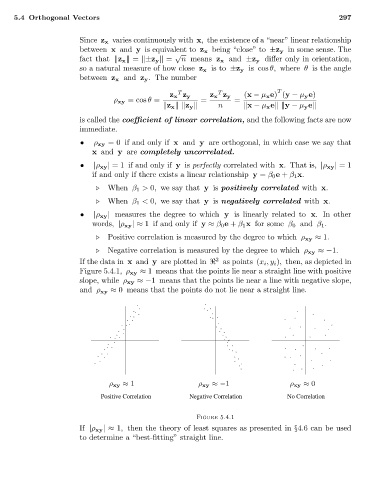
If the data in x and y are plotted in as points (x i ,y i ), then, as depicted in
Figure 5.4.1, ρ xy ≈ 1 means that the points lie near a straight line with positive
slope, while ρ xy ≈−1 means that the points lie near a line with negative slope,
and ρ xy ≈ 0 means that the points do not lie near a straight line.
.
. . . .
. . . . . . .
. . . . . .
. . . . .
. . . . . . . .
. . . . . . .
. . . . . . . . . .
. . . . . . . . .
. .. . . . . . . .
. . . . . . . . .
.
. . . . . . . . .
. . . .
ρ xy ≈ 1 ρ xy ≈−1 ρ xy ≈ 0
Positive Correlation Negative Correlation No Correlation
Figure 5.4.1
If |ρ xy |≈ 1, then the theory of least squares as presented in §4.6 can be used
to determine a “best-fitting” straight line.