
Page 29 - Mechanical Engineer's Data Handbook
P. 29
18 MECHANICAL ENGINEER’S DATA HANDBOOK
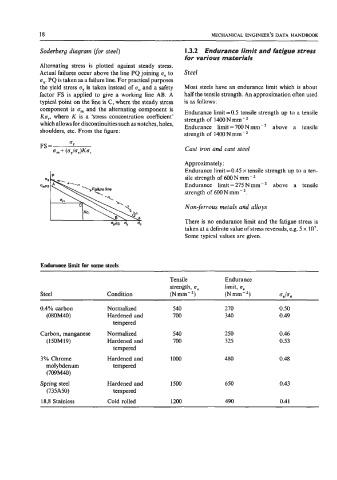
Soderberg diagram vor steel) I .3.2 Endurance limit and fatigue stress
for various materials
Alternating stress is plotted against steady stress.
Actual failures occur above the line PQ joining u, to Steel
u,. PQ is taken as a failure line. For practical purposes
the yield stress oY is taken instead of u, and a safety Most steels have an endurance limit which is about
factor FS is applied to give a working line AB. A half the tensile strength. An approximation often used
typical point on the line is C, where the steady stress is as follows:
component is a,,, and the alternating component is Endurance limit =0.5 tensile strength up to a tensile
Ku,, where K is a ‘stress concentration coefficient’ strength of 1400Nmm-2
which allows for discontinuities such as notches, holes, above a tensile
shoulders, etc. From the figure: Endurance limit = 700 N mm -
strength of 1400Nmm-2
FS = QY Cast iron and cast steel
Qnl + (Cy/%)KQ,
Approximately :
Endurance limit =0.45 x tensile strength up to a ten-
IP
sile strength of 600Nmm-2
Endurance limit = 275 N mm-2 above a tensile
strength of 600Nmm-’.
Non-ferrous metals and alloys
There is no endurance limit and the fatigue stress is
taken at a definite value of stress reversals, e.g. 5 x 10’.
Some typical values are given.
Endurance limit for some steels
Tensile Endurance
strength, u, limit, u,
Steel Condition (Nmm-2) (N mm-2) QJUU
0.4% carbon Normalized 540 270 0.50
(080M40) Hardened and 700 340 0.49
tempered
Carbon, manganese Normalized 540 250 0.46
(1 50M 19) Hardened and 700 325 0.53
tempered
3% Chrome Hardened and lo00 480 0.48
molybdenum tempered
(709M40)
Spring steel Hardened and 1500 650 0.43
(735ASO) tempered
18,8 Stainless Cold rolled 1 200 490 0.41