
Page 169 - Mechanical Engineers' Handbook (Volume 2)
P. 169
158 Temperature and Flow Transducers
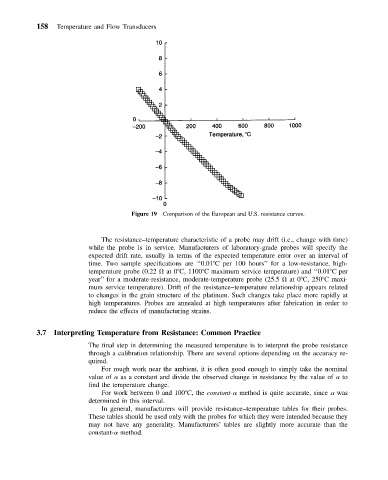
Figure 19 Comparison of the European and U.S. resistance curves.
The resistance–temperature characteristic of a probe may drift (i.e., change with time)
while the probe is in service. Manufacturers of laboratory-grade probes will specify the
expected drift rate, usually in terms of the expected temperature error over an interval of
time. Two sample specifications are ‘‘0.01 C per 100 hours’’ for a low-resistance, high-
temperature probe (0.22 at 0 C, 1100 C maximum service temperature) and ‘‘0.01 C per
year’’ for a moderate-resistance, moderate-temperature probe (25.5 at 0 C, 250 C maxi-
mum service temperature). Drift of the resistance–temperature relationship appears related
to changes in the grain structure of the platinum. Such changes take place more rapidly at
high temperatures. Probes are annealed at high temperatures after fabrication in order to
reduce the effects of manufacturing strains.
3.7 Interpreting Temperature from Resistance: Common Practice
The final step in determining the measured temperature is to interpret the probe resistance
through a calibration relationship. There are several options depending on the accuracy re-
quired.
For rough work near the ambient, it is often good enough to simply take the nominal
value of as a constant and divide the observed change in resistance by the value of to
find the temperature change.
For work between 0 and 100 C, the constant- method is quite accurate, since was
determined in this interval.
In general, manufacturers will provide resistance–temperature tables for their probes.
These tables should be used only with the probes for which they were intended because they
may not have any generality. Manufacturers’ tables are slightly more accurate than the
constant- method.