
Page 238 - Mechanical Engineers' Handbook (Volume 2)
P. 238
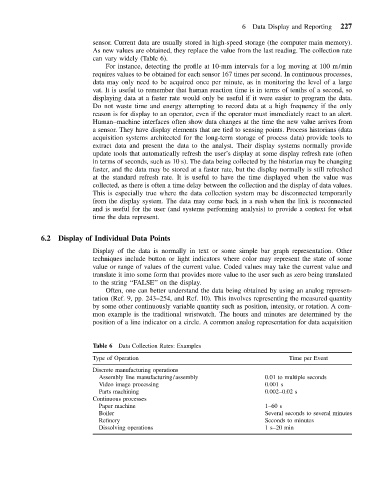
6 Data Display and Reporting  227

                           sensor. Current data are usually stored in high-speed storage (the computer main memory).
                           As new values are obtained, they replace the value from the last reading. The collection rate
                           can vary widely (Table 6).
                              For instance, detecting the profile at 10-mm intervals for a log moving at 100 m/min
                           requires values to be obtained for each sensor 167 times per second. In continuous processes,
                           data may only need to be acquired once per minute, as in monitoring the level of a large
                           vat. It is useful to remember that human reaction time is in terms of tenths of a second, so
                           displaying data at a faster rate would only be useful if it were easier to program the data.
                           Do not waste time and energy attempting to record data at a high frequency if the only
                           reason is for display to an operator, even if the operator must immediately react to an alert.
                           Human–machine interfaces often show data changes at the time the new value arrives from
                           a sensor. They have display elements that are tied to sensing points. Process historians (data
                           acquisition systems architected for the long-term storage of process data) provide tools to
                           extract data and present the data to the analyst. Their display systems normally provide
                           update tools that automatically refresh the user’s display at some display refresh rate (often
                           in terms of seconds, such as 10 s). The data being collected by the historian may be changing
                           faster, and the data may be stored at a faster rate, but the display normally is still refreshed
                           at the standard refresh rate. It is useful to have the time displayed when the value was
                           collected, as there is often a time delay between the collection and the display of data values.
                           This is especially true where the data collection system may be disconnected temporarily
                           from the display system. The data may come back in a rush when the link is reconnected
                           and is useful for the user (and systems performing analysis) to provide a context for what
                           time the data represent.


            6.2  Display of Individual Data Points
                           Display of the data is normally in text or some simple bar graph representation. Other
                           techniques include button or light indicators where color may represent the state of some
                           value or range of values of the current value. Coded values may take the current value and
                           translate it into some form that provides more value to the user such as zero being translated
                           to the string ‘‘FALSE’’ on the display.
                              Often, one can better understand the data being obtained by using an analog represen-
                           tation (Ref. 9, pp. 243–254, and Ref. 10). This involves representing the measured quantity
                           by some other continuously variable quantity such as position, intensity, or rotation. A com-
                           mon example is the traditional wristwatch. The hours and minutes are determined by the
                           position of a line indicator on a circle. A common analog representation for data acquisition


                           Table 6 Data Collection Rates: Examples
                           Type of Operation                                     Time per Event
                           Discrete manufacturing operations
                             Assembly line manufacturing/assembly          0.01 to multiple seconds
                             Video image processing                        0.001 s
                             Parts machining                               0.002–0.02 s
                           Continuous processes
                             Paper machine                                 1–60 s
                             Boiler                                        Several seconds to several minutes
                             Refinery                                       Seconds to minutes
                             Dissolving operations                         1s–20 min