
Page 241 - Mechanical Engineers' Handbook (Volume 2)
P. 241
230 Data Acquisition and Display Systems
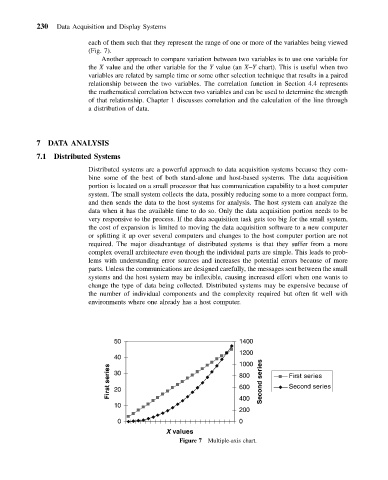
each of them such that they represent the range of one or more of the variables being viewed
(Fig. 7).
Another approach to compare variation between two variables is to use one variable for
the X value and the other variable for the Y value (an X–Y chart). This is useful when two
variables are related by sample time or some other selection technique that results in a paired
relationship between the two variables. The correlation function in Section 4.4 represents
the mathematical correlation between two variables and can be used to determine the strength
of that relationship. Chapter 1 discusses correlation and the calculation of the line through
a distribution of data.
7 DATA ANALYSIS
7.1 Distributed Systems
Distributed systems are a powerful approach to data acquisition systems because they com-
bine some of the best of both stand-alone and host-based systems. The data acquisition
portion is located on a small processor that has communication capability to a host computer
system. The small system collects the data, possibly reducing some to a more compact form,
and then sends the data to the host systems for analysis. The host system can analyze the
data when it has the available time to do so. Only the data acquisition portion needs to be
very responsive to the process. If the data acquisition task gets too big for the small system,
the cost of expansion is limited to moving the data acquisition software to a new computer
or splitting it up over several computers and changes to the host computer portion are not
required. The major disadvantage of distributed systems is that they suffer from a more
complex overall architecture even though the individual parts are simple. This leads to prob-
lems with understanding error sources and increases the potential errors because of more
parts. Unless the communications are designed carefully, the messages sent between the small
systems and the host system may be inflexible, causing increased effort when one wants to
change the type of data being collected. Distributed systems may be expensive because of
the number of individual components and the complexity required but often fit well with
environments where one already has a host computer.
50 1400
1200
40 1000
First series 30 800 Second series First series
600
Second series
20
10 400
200
0 0
X values
Figure 7 Multiple-axis chart.