
Page 239 - Mechanical Engineers' Handbook (Volume 2)
P. 239
228 Data Acquisition and Display Systems
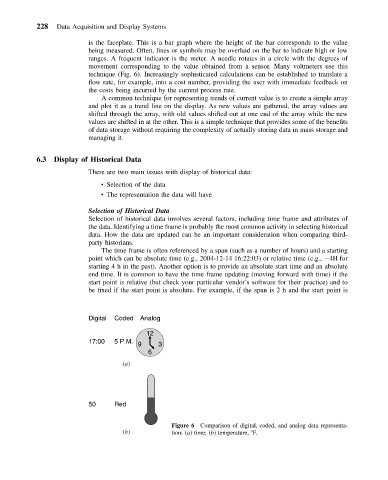
is the faceplate. This is a bar graph where the height of the bar corresponds to the value
being measured. Often, lines or symbols may be overlaid on the bar to indicate high or low
ranges. A frequent indicator is the meter. A needle rotates in a circle with the degrees of
movement corresponding to the value obtained from a sensor. Many voltmeters use this
technique (Fig. 6). Increasingly sophisticated calculations can be established to translate a
flow rate, for example, into a cost number, providing the user with immediate feedback on
the costs being incurred by the current process rate.
A common technique for representing trends of current value is to create a simple array
and plot it as a trend line on the display. As new values are gathered, the array values are
shifted through the array, with old values shifted out at one end of the array while the new
values are shifted in at the other. This is a simple technique that provides some of the benefits
of data storage without requiring the complexity of actually storing data in mass storage and
managing it.
6.3 Display of Historical Data
There are two main issues with display of historical data:
• Selection of the data
• The representation the data will have
Selection of Historical Data
Selection of historical data involves several factors, including time frame and attributes of
the data. Identifying a time frame is probably the most common activity in selecting historical
data. How the data are updated can be an important consideration when comparing third-
party historians.
The time frame is often referenced by a span (such as a number of hours) and a starting
point which can be absolute time (e.g., 2004-12-14 16:22:03) or relative time (e.g., 4H for
starting4hinthe past). Another option is to provide an absolute start time and an absolute
end time. It is common to have the time frame updating (moving forward with time) if the
start point is relative (but check your particular vendor’s software for their practice) and to
be fixed if the start point is absolute. For example, if the span is 2 h and the start point is
Digital Coded Analog
12
17:00 5 P.M.
9 3
6
(a)
50 Red
Figure 6 Comparison of digital, coded, and analog data representa-
(b) tion: (a) time; (b) temperature, F.