
Page 348 - Mechanical Engineers' Handbook (Volume 2)
P. 348
5 Approaches to Linear Systems Analysis 339
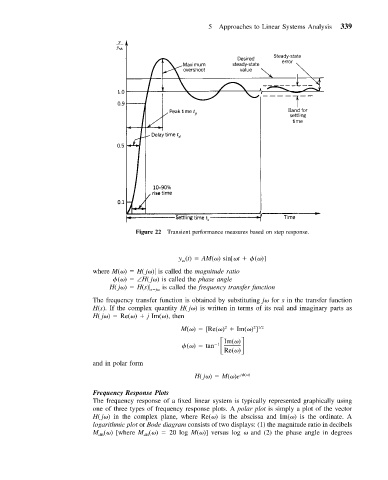
Figure 22 Transient performance measures based on step response.
y (t) AM( ) sin[ t ( )]
ss
where M( ) H( j ) is called the magnitude ratio
( ) ∠H( j ) is called the phase angle
H( j ) H(s) s j is called the frequency transfer function
The frequency transfer function is obtained by substituting j for s in the transfer function
H(s). If the complex quantity H( j ) is written in terms of its real and imaginary parts as
H( j ) Re( ) j Im( ), then
2
2 1/2
M( ) [Re( ) Im( )]
( ) tan
Im( )
1
Re( )
and in polar form
H( j ) M( )e j ( )
Frequency Response Plots
The frequency response of a fixed linear system is typically represented graphically using
one of three types of frequency response plots. A polar plot is simply a plot of the vector
H( j ) in the complex plane, where Re( ) is the abscissa and Im( ) is the ordinate. A
logarithmic plot or Bode diagram consists of two displays: (1) the magnitude ratio in decibels
M ( ) [where M ( ) 20 log M( )] versus log and (2) the phase angle in degrees
dB
dB