
Page 465 - Mechanical Engineers' Handbook (Volume 2)
P. 465
456 Closed-Loop Control System Analysis
2.5 Inverse Transform by a General Formula
Given the Laplace transform F(s) of a time function ƒ(t), the following expression holds
true:
ƒ(t) c j ts
1
2
j c j F(s)eds (26)
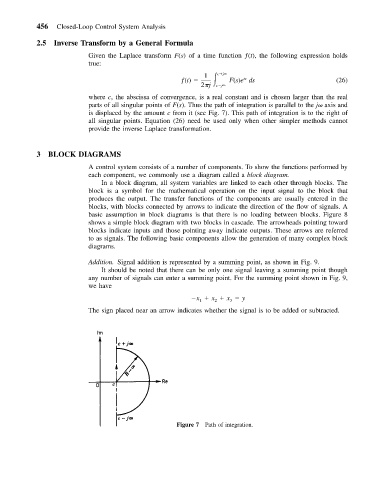
where c, the abscissa of convergence, is a real constant and is chosen larger than the real
parts of all singular points of F(s). Thus the path of integration is parallel to the j axis and
is displaced by the amount c from it (see Fig. 7). This path of integration is to the right of
all singular points. Equation (26) need be used only when other simpler methods cannot
provide the inverse Laplace transformation.
3 BLOCK DIAGRAMS
A control system consists of a number of components. To show the functions performed by
each component, we commonly use a diagram called a block diagram.
In a block diagram, all system variables are linked to each other through blocks. The
block is a symbol for the mathematical operation on the input signal to the block that
produces the output. The transfer functions of the components are usually entered in the
blocks, with blocks connected by arrows to indicate the direction of the flow of signals. A
basic assumption in block diagrams is that there is no loading between blocks. Figure 8
shows a simple block diagram with two blocks in cascade. The arrowheads pointing toward
blocks indicate inputs and those pointing away indicate outputs. These arrows are referred
to as signals. The following basic components allow the generation of many complex block
diagrams.
Addition. Signal addition is represented by a summing point, as shown in Fig. 9.
It should be noted that there can be only one signal leaving a summing point though
any number of signals can enter a summing point. For the summing point shown in Fig. 9,
we have
x x x y
2
3
1
The sign placed near an arrow indicates whether the signal is to be added or subtracted.
Figure 7 Path of integration.