
Page 253 - Mechanical Engineers' Handbook (Volume 4)
P. 253
242 Furnaces
Charts have been prepared by Gurney-Lurie, Heisler, Hottel, and others showing values
for Y and Y for various R factors as a function of X. Separate charts are provided for Y s
s
c
and Y , with a series of curves representing a series of values of R. These curves are straight
c
lines for most of their length, curving to intersect at Y 1 and X 0. If straight lines are
extended to Y 1, the curves for Y at all values of R converge at a point near X 0.1 on
c
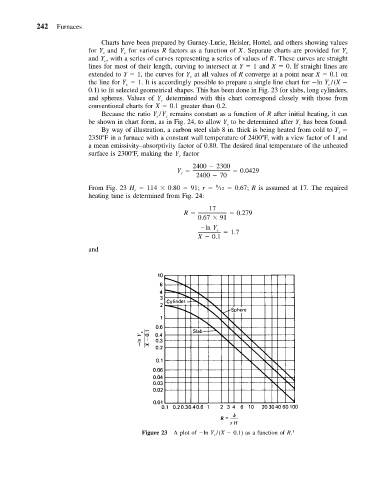
the line for Y 1. It is accordingly possible to prepare a single line chart for ln Y /(X
c
c
0.1) to fit selected geometrical shapes. This has been done in Fig. 23 for slabs, long cylinders,
and spheres. Values of Y determined with this chart correspond closely with those from
c
conventional charts for X 0.1 greater than 0.2.
Because the ratio Y /Y remains constant as a function of R after initial heating, it can
c
s
be shown in chart form, as in Fig. 24, to allow Y to be determined after Y has been found.
s
c
By way of illustration, a carbon steel slab 8 in. thick is being heated from cold to T
s
2350 F in a furnace with a constant wall temperature of 2400 F, with a view factor of 1 and
a mean emissivity–absorptivity factor of 0.80. The desired final temperature of the unheated
surface is 2300 F, making the Y factor
c
2400 2300
Y 0.0429
c
2400 70
8
From Fig. 23 H 114 0.80 91; r ⁄12 0.67; R is assumed at 17. The required
r
heating time is determined from Fig. 24:
17
R 0.279
0.67 91
ln Y c
X 0.1 1.7
and
Figure 23 A plot of ln Y c /(X 0.1) as a function of R. 1