
Page 302 - Mechanical Engineers' Handbook (Volume 4)
P. 302
3 Performing an Energy Audit—Identifying Opportunities for Saving Energy 291
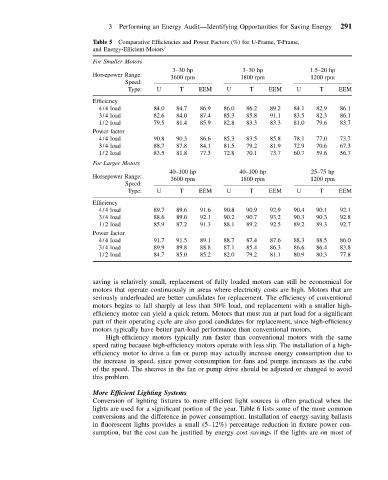
Table 5 Comparative Efficiencies and Power Factors (%) for U-Frame, T-Frame,
and Energy-Efficient Motors 7
For Smaller Motors
3–30 hp 3–30 hp 1.5–20 hp
Horsepower Range: 3600 rpm 1800 rpm 1200 rpm
Speed:
Type: U T EEM U T EEM U T EEM
Efficiency
4/4 load 84.0 84.7 86.9 86.0 86.2 89.2 84.1 82.9 86.1
3/4 load 82.6 84.0 87.4 85.3 85.8 91.1 83.5 82.3 86.1
1/2 load 79.5 81.4 85.9 82.8 83.3 83.3 81.0 79.6 83.7
Power factor
4/4 load 90.8 90.3 86.6 85.3 83.5 85.8 78.1 77.0 73.7
3/4 load 88.7 87.8 84.1 81.5 79.2 81.9 72.9 70.6 67.3
1/2 load 83.5 81.8 77.3 72.8 70.1 73.7 60.7 59.6 56.7
For Larger Motors
40–100 hp 40–100 hp 25–75 hp
Horsepower Range: 3600 rpm 1800 rpm 1200 rpm
Speed:
Type: U T EEM U T EEM U T EEM
Efficiency
4/4 load 89.7 89.6 91.6 90.8 90.9 92.9 90.4 90.1 92.1
3/4 load 88.6 89.0 92.1 90.2 90.7 93.2 90.3 90.3 92.8
1/2 load 85.9 87.2 91.3 88.1 89.2 92.5 89.2 89.3 92.7
Power factor
4/4 load 91.7 91.5 89.1 88.7 87.4 87.6 88.3 88.5 86.0
3/4 load 89.9 89.8 88.8 87.1 85.4 86.3 86.6 86.4 83.8
1/2 load 84.7 85.0 85.2 82.0 79.2 81.1 80.9 80.3 77.8
saving is relatively small, replacement of fully loaded motors can still be economical for
motors that operate continuously in areas where electricity costs are high. Motors that are
seriously underloaded are better candidates for replacement. The efficiency of conventional
motors begins to fall sharply at less than 50% load, and replacement with a smaller high-
efficiency motor can yield a quick return. Motors that must run at part load for a significant
part of their operating cycle are also good candidates for replacement, since high-efficiency
motors typically have better part-load performance than conventional motors.
High-efficiency motors typically run faster than conventional motors with the same
speed rating because high-efficiency motors operate with less slip. The installation of a high-
efficiency motor to drive a fan or pump may actually increase energy consumption due to
the increase in speed, since power consumption for fans and pumps increases as the cube
of the speed. The sheaves in the fan or pump drive should be adjusted or changed to avoid
this problem.
More Efficient Lighting Systems
Conversion of lighting fixtures to more efficient light sources is often practical when the
lights are used for a significant portion of the year. Table 6 lists some of the more common
conversions and the difference in power consumption. Installation of energy-saving ballasts
in fluorescent lights provides a small (5–12%) percentage reduction in fixture power con-
sumption, but the cost can be justified by energy cost savings if the lights are on most of