
Page 78 - Mechanics Analysis Composite Materials
P. 78
Chapter 3. Mechanics of a unidirectional ply 63
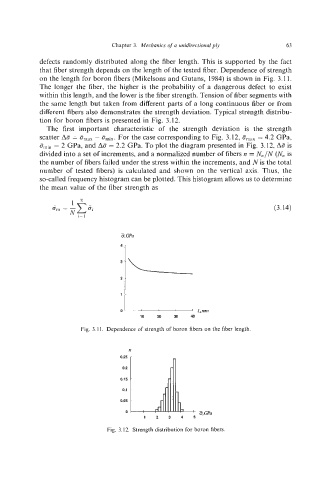
defects randomly distributed along the fiber length. This is supported by the fact
that fiber strength depends on the length of the tested fiber. Dependence of strength
on the length for boron fibers (Mikelsons and Gutans, 1984) is shown in Fig. 3.1 1.
The longer the fiber, the higher is the probability of a dangerous defect to exist
within this length, and the lower is the fiber strength. Tension of fiber segments with
the same length but taken from different parts of a long continuous fiber or from
different fibers also demonstrates the strength deviation. Typical strength distribu-
tion for boron fibers is presented in Fig. 3.12.
The first important characteristic of the strength deviation is the strength
scatter A@= O,,, - Cmin. For the case corresponding to Fig. 3.12, amax= 4.2 GPa,
Omin = 2 GPa, and A8 = 2.2 GPa. To plot the diagram presented in Fig. 3.12, A6 is
divided into a set of increments, and a normalized number of fibers n = N,/N (N, is
the number of fibers failed under the stress within the increments, and N is the total
number of tested fibers) is calculated and shown on the vertical axis. Thus, the
so-called frequency histogram can be plotted. This histogram allows us to determine
the mean value of the fiber strength as
* 3
a,,, = - ai (3.14)
N.
,=I
5,GPa
l O P 3 0 4 0
Fig. 3.1 1. Dependence of strength of boron fibers on the fiber length.
n
025
0.2
0.15
0.1
0.05
0 -
qGPa
1 2 3 4 5
Fig. 3.12. Strength distribution for boron fibers.