
Page 79 - Mechanics Analysis Composite Materials
P. 79
64 Mechanics and analysis of’composite maierials
and the strength dispersion as
(3.15)
i=l
The deviation of fiber strength is characterized with the coefficient of the strength
variation which is presented as follows
do
r, =:loo% . (3.16)
brn
For boron fibers under consideration, Eqs. (3.14X3.16) yield om= 3.2 GPa, d, =
0.4 GPa, r, = 12.5%.
To demonstrate the influence of fiber strength deviation on the strength of a
unidirectional ply, consider a bundle of fibers, i.e., a system of approximately parallel
fibers with different strength and slightly different lengths as in Fig. 3.13. Typical
stress-strain diagrams for fibers tested under tension in a bundle are shown in
Fig. 3.14 (Vasiliev and Tarnopol’skii, 1990). As can be seen, the diagrams have two
nonlinear segments. Nonlinearity in the vicinity of zero stresses is associated with
different lengths of fibers in the bundles, while nonlinear behavior of the bundle under
stresses close to the ultimate values is caused by fracture of fibers with lower strength.
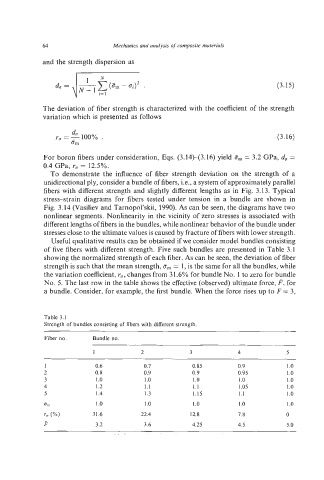
Useful qualitative results can be obtained if we consider model bundles consisting
of five fibers with different strength. Five such bundles are presented in Table 3.1
showing the normalized strength of each fiber. As can be seen, the deviation of fiber
strength is such that the mean strength, am= 1,is the same for all the bundles, while
the variation coefficient,r,, changes from 31.6% for bundle No. 1 to zero for bundle
No. 5. The last row in the table shows the effective (observed) ultimate force, F, for
a bundle. Consider, for example, the first bundle. When the force rises up to F = 3,
Table 3.1
Strength of bundles consisting of fibers with different strength.
Fiber no. Bundle no.
1 2 3 4 5
0.6 0.7 0.85 0.9 1 .o
0.8 0.9 0.9 0.95 1.o
1 .o I .o 1 .o 1.o 1.o
1.2 1.1 1.1 1.Q5 1.Q
1.4 1.3 1.15 1.1 1 .o
1.o 1 .o I .o 1.o 1 .o
31.6 22.4 12.8 7.8 0
3.2 3.6 4.25 4.5 5.0