
Page 114 - Mechanics of Asphalt Microstructure and Micromechanics
P. 114
106 Ch a p t e r F o u r
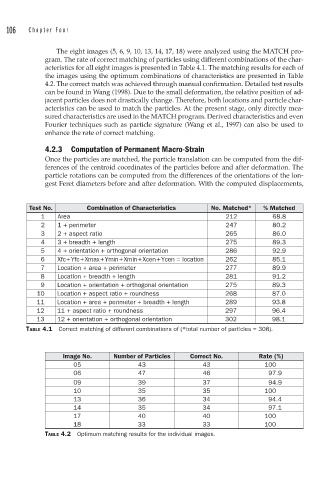
The eight images (5, 6, 9, 10, 13, 14, 17, 18) were analyzed using the MATCH pro-
gram. The rate of correct matching of particles using different combinations of the char-
acteristics for all eight images is presented in Table 4.1. The matching results for each of
the images using the optimum combinations of characteristics are presented in Table
4.2. The correct match was achieved through manual confirmation. Detailed test results
can be found in Wang (1998). Due to the small deformation, the relative position of ad-
jacent particles does not drastically change. Therefore, both locations and particle char-
acteristics can be used to match the particles. At the present stage, only directly mea-
sured characteristics are used in the MATCH program. Derived characteristics and even
Fourier techniques such as particle signature (Wang et al., 1997) can also be used to
enhance the rate of correct matching.
4.2.3 Computation of Permanent Macro-Strain
Once the particles are matched, the particle translation can be computed from the dif-
ferences of the centroid coordinates of the particles before and after deformation. The
particle rotations can be computed from the differences of the orientations of the lon-
gest Feret diameters before and after deformation. With the computed displacements,
Test No. Combination of Characteristics No. Matched* % Matched
1 Area 212 68.8
2 1 + perimeter 247 80.2
3 2 + aspect ratio 265 86.0
4 3 + breadth + length 275 89.3
5 4 + orientation + orthogonal orientation 286 92.9
6 Xfc + Yfc + Xmax + Ymin + Xmin + Xcen + Ycen = location 262 85.1
7 Location + area + perimeter 277 89.9
8 Location + breadth + length 281 91.2
9 Location + orientation + orthogonal orientation 275 89.3
10 Location + aspect ratio + roundness 268 87.0
11 Location + area + perimeter + breadth + length 289 93.8
12 11 + aspect ratio + roundness 297 96.4
13 12 + orientation + orthogonal orientation 302 98.1
TABLE 4.1 Correct matching of different combinations of (*total number of particles = 308).
Image No. Number of Particles Correct No. Rate (%)
05 43 43 100
06 47 46 97.9
09 39 37 94.9
10 35 35 100
13 36 34 94.4
14 35 34 97.1
17 40 40 100
18 33 33 100
TABLE 4.2 Optimum matching results for the individual images.