
Page 117 - Mechanics of Asphalt Microstructure and Micromechanics
P. 117
Experimental Methods to Characterize the Heterogeneous Strain F ield 109
P No. Xcen (p) Ycen(p) Orientation u (p) v (p) Rotation Strain
9 (U) 354.7 92.3 138.0 ε x = 0.0116
11 310.3 123.2 53.0 ε y = 0.0231
14 361.1 149.7 127.0 ε xy = 0.0525
9 (D) 378.5 95.6 135.0 23.8 3.3 −3.0 ε v = 0.0347
10 335.5 126.6 51.0 25.2 3.4 2.0
14 389.4 151.8 127.0 28.3 2.1 0.0
TABLE 4.3 Input for the mastic strain measurement and the global strains.
It should be also noticed from the volumetric strain contours (Figure 4.7) that dilation
and contraction coexist within a few adjacent particles in the same image. This is quite
reasonable as dilation and contraction are related to particle configurations that can be
quite different among adjacent particles. In other words, tensile and compressive strains
can take place within a few particles (a discrete element method [DEM] simulation also
indicates this phenomena, see Chapter 9). From the plots of the volumetric strains, the
direct strains, and the shear strains, it is evident that the macro-strain contours are quite
complicated and indicative of the influence of the particle configurations.
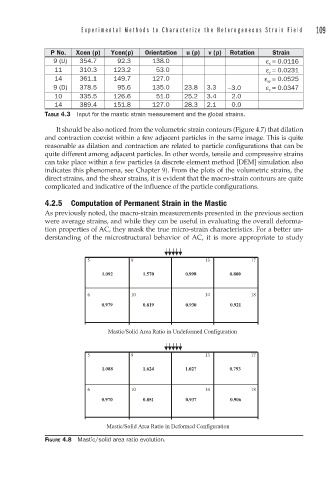
4.2.5 Computation of Permanent Strain in the Mastic
As previously noted, the macro-strain measurements presented in the previous section
were average strains, and while they can be useful in evaluating the overall deforma-
tion properties of AC, they mask the true micro-strain characteristics. For a better un-
derstanding of the microstructural behavior of AC, it is more appropriate to study
FIGURE 4.8 Mastic/solid area ratio evolution.