
Page 121 - Mechanics of Asphalt Microstructure and Micromechanics
P. 121
Experimental Methods to Characterize the Heterogeneous Strain F ield 113
4.3 3D Methodology
For the 3D case, XCT imaging is used to obtain the internal structure of the materials
non-destructively (as described in Chapter 3). The method similar to the 2D case will
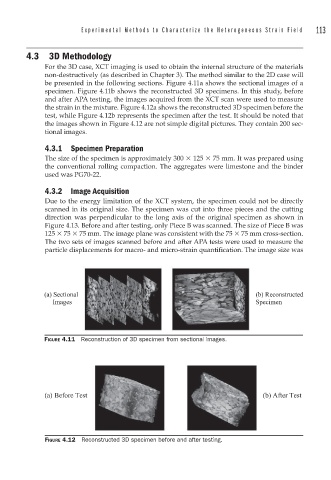
be presented in the following sections. Figure 4.11a shows the sectional images of a
specimen. Figure 4.11b shows the reconstructed 3D specimens. In this study, before
and after APA testing, the images acquired from the XCT scan were used to measure
the strain in the mixture. Figure 4.12a shows the reconstructed 3D specimen before the
test, while Figure 4.12b represents the specimen after the test. It should be noted that
the images shown in Figure 4.12 are not simple digital pictures. They contain 200 sec-
tional images.
4.3.1 Specimen Preparation
The size of the specimen is approximately 300 125 75 mm. It was prepared using
the conventional rolling compaction. The aggregates were limestone and the binder
used was PG70-22.
4.3.2 Image Acquisition
Due to the energy limitation of the XCT system, the specimen could not be directly
scanned in its original size. The specimen was cut into three pieces and the cutting
direction was perpendicular to the long axis of the original specimen as shown in
Figure 4.13. Before and after testing, only Piece B was scanned. The size of Piece B was
125 75 75 mm. The image plane was consistent with the 75 75 mm cross-section.
The two sets of images scanned before and after APA tests were used to measure the
particle displacements for macro- and micro-strain quantification. The image size was
FIGURE 4.11 Reconstruction of 3D specimen from sectional images.
FIGURE 4.12 Reconstructed 3D specimen before and after testing.