
Page 122 - Mechanics of Asphalt Microstructure and Micromechanics
P. 122
114 Ch a p t e r F o u r
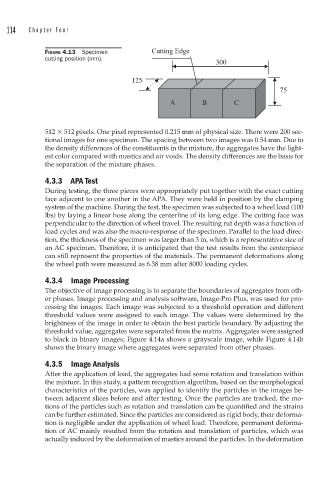
FIGURE 4.13 Specimen
cutting position (mm).
512 512 pixels. One pixel represented 0.215 mm of physical size. There were 200 sec-
tional images for one specimen. The spacing between two images was 0.54 mm. Due to
the density differences of the constituents in the mixture, the aggregates have the light-
est color compared with mastics and air voids. The density differences are the basis for
the separation of the mixture phases.
4.3.3 APA Test
During testing, the three pieces were appropriately put together with the exact cutting
face adjacent to one another in the APA. They were held in position by the clamping
system of the machine. During the test, the specimen was subjected to a wheel load (100
lbs) by laying a linear hose along the centerline of its long edge. The cutting face was
perpendicular to the direction of wheel travel. The resulting rut depth was a function of
load cycles and was also the macro-response of the specimen. Parallel to the load direc-
tion, the thickness of the specimen was larger than 3 in, which is a representative size of
an AC specimen. Therefore, it is anticipated that the test results from the centerpiece
can still represent the properties of the materials. The permanent deformations along
the wheel path were measured as 6.38 mm after 8000 loading cycles.
4.3.4 Image Processing
The objective of image processing is to separate the boundaries of aggregates from oth-
er phases. Image processing and analysis software, Image-Pro Plus, was used for pro-
cessing the images. Each image was subjected to a threshold operation and different
threshold values were assigned to each image. The values were determined by the
brightness of the image in order to obtain the best particle boundary. By adjusting the
threshold value, aggregates were separated from the matrix. Aggregates were assigned
to black in binary images; Figure 4.14a shows a grayscale image, while Figure 4.14b
shows the binary image where aggregates were separated from other phases.
4.3.5 Image Analysis
After the application of load, the aggregates had some rotation and translation within
the mixture. In this study, a pattern recognition algorithm, based on the morphological
characteristics of the particles, was applied to identify the particles in the images be-
tween adjacent slices before and after testing. Once the particles are tracked, the mo-
tions of the particles such as rotation and translation can be quantified and the strains
can be further estimated. Since the particles are considered as rigid body, their deforma-
tion is negligible under the application of wheel load. Therefore, permanent deforma-
tion of AC mainly resulted from the rotation and translation of particles, which was
actually induced by the deformation of mastics around the particles. In the deformation